Biomedical Engineering Reference
In-Depth Information
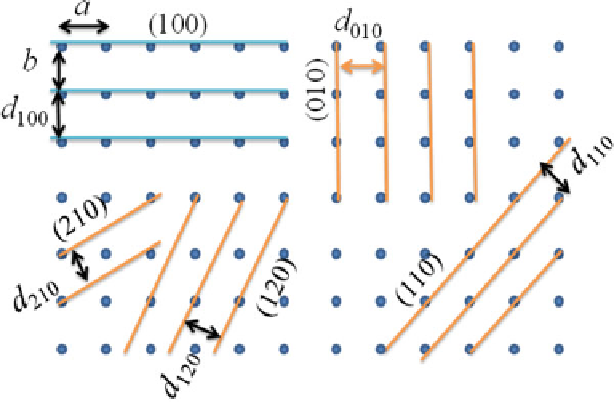
Fig. 2.16
An orthorhombic lattice projected along the
c
axis. The projections of (100), (010),
(110), (120), and (210) lattice plans and the corresponding spacings
increase of the spacing. Then the growth rate in the same orientation will decrease
correspondingly.
The structure of the morphology of crystals can be plotted by the Gubbs-Wulff
plot [
13
] based on (
2.29
) and the symmetry of the crystals.
One of the most popular theories is the Hartman-Perdok theory or the periodic
bond chain (PBC) theory, which was first published by Hartman and Perdok [
13
,
74
-
77
]. The key points of the PBC theory can be summarized as follows:
1. In a crystal structure, one can always identify some
uninterrupted
periodic
strong
bond chains (PBCs), running through the crystal structure.
2. A PBC along the direction of [
uvw
] should have the basic crystallographic period
in the given direction.
3. If one PBC period consists of different types of bonds, the strength of PBC will
be determined by the weakest bond.
4. The important crystallographic directions must be in line with the strong PBCs.
An example of PBC analysis is given by Fig.
2.17
. In the bond structure given,
three PBCs can be identified: PBC[
uvw
], PBC[
u
1
v
1
w
1
], PBC[
u
2
v
2
w
2
]. If the rank of
the bond strength is given as strong bond 1 > strong bond 2
weak bond 1 > weak
bond 2, one has then PBC[
uvw
] > PBC[
u
1
v
1
w
1
] > PBC[
u
2
v
2
w
2
].
Based on the concept of PBC, the crystal faces can be classified into three types:
F-face, S-face, and K-face (cf. Fig.
2.18
).
•
F-face: Flat face—more than two nonparallel PBCs in parallel to the surface are
identified.