Geoscience Reference
In-Depth Information
60
50
40
30
Downstream reach
20
Study reach
10
Headwater reach
0
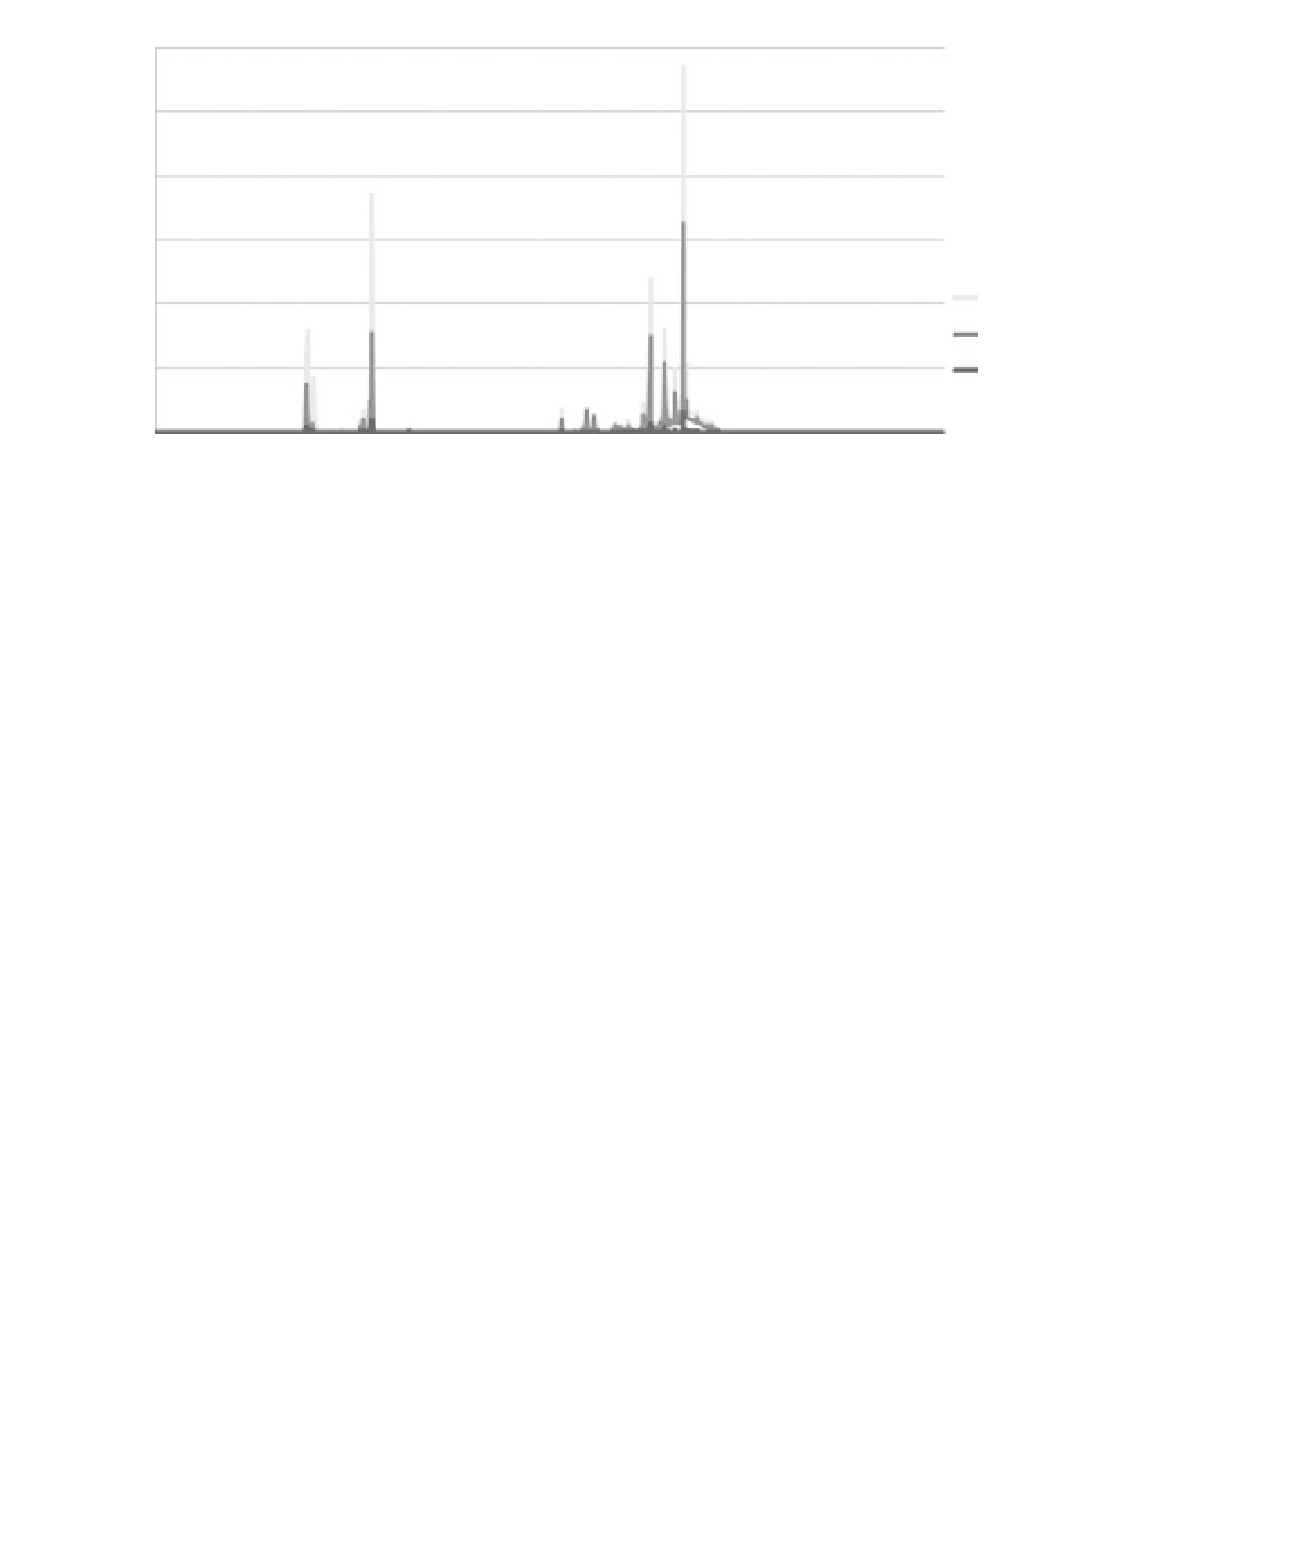
Figure 22.4
Hydrograph outputs for the two hydrological years (October 2007-October 2009) generated from the
SWAT model. The lines represent different reaches of the Ribeira da Pardiela.
simulations were able to capture the annual
pattern of flow with an adjustment factor of r
2
=
catchment (Figure 22.5). As expected, this shows
that the main-stem channel accounts for the
greatest proportion while headwaters contribute
the smallest amount. Transforming the modelled
data into an estimate of the percentage of days
without flow over the 2-year period shows the
effects of the seasonal pattern more clearly (Figure
22.6). Headwaters had no flow for 89% of days
compared with 56-84% in the middle reaches and
56% at the downstream end.
in
situ
measurements). Given the good calibration
between the model and field measurements, the
SWAT model was used to estimate total annual
runoff from the entire catchment. The modelled
hydrographs demonstrated the typical pattern
of annual discharge in temporary streams; an
expansion period during October to April and a
contraction period from late May to September
(Figure 22.4). The headwater reaches had a natural
tendency to flow only during and shortly after
heavy rainfall. In the middle reaches flow started
as a result of the first autumn flood and a base flow
was maintained until late spring, when a lack of
rainfall and increasing temperatures gradually led
to an interruption in flow causing contraction of
the stream into a series of large pools. The pattern
for the downstream reaches was similar to the
middle reaches but with higher discharge levels. In
all cases maximum discharge occurred during flood
events.
The SWAT model was able to estimate total
runoff for the two hydrological years and allocate
the proportion of this to different parts of the
0.9693
(SWAT
simulations
=
1.9146
×
Land use and stream morphology
Comparison of aerial photographs (Figure 22.1)
indicates that predominant land-use in the study
site remained broadly the same between 1958 and
2007. Holm oak forest declined from 46% to 36%
and olive groves from 23% to 22%, whilst pasture
land increased from 30% to 34%. The most notable
changes were an increase in urban land-use from
1% to 4% and the establishment of vineyards,
which occupied 4% of land in 2005. Average
channel width declined from 38.8 m to 17.6 m,
while morphological features such as gravel bars
that were obvious in the 1958 aerial photograph
were no longer visible in the narrower channel