Geoscience Reference
In-Depth Information
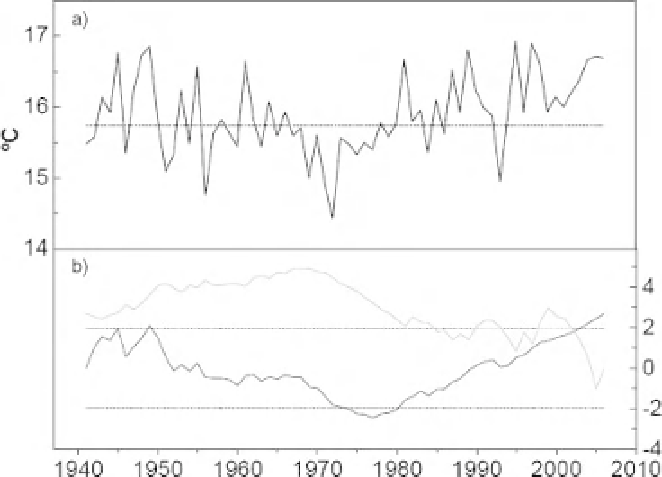
Figure 22.2
a) Annual variability of
mean air temperature in the Pardiela
catchment during 1941-2006. The
dashed line represents the average air
temperature during the period
1961-1990 (data from the Evora
weather station). b) Progressive (dark
grey) and retrograde (light grey) series
of Mann-Kendall statistic test. The
dashed lines represent the significance
boundaries (t
=
1.96;
=
0.05).
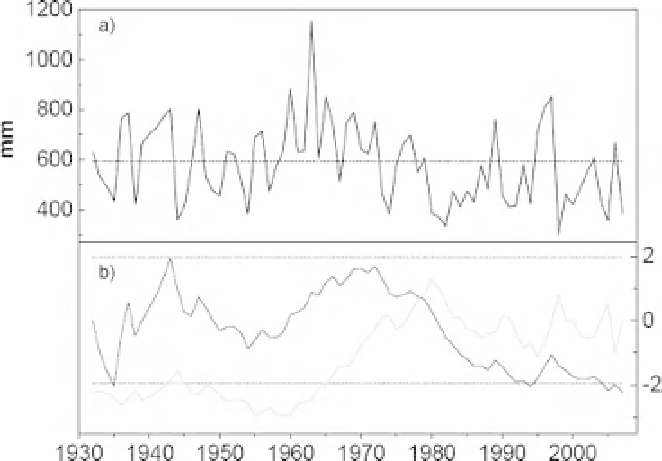
precipitation for 1961-1990 (Figure 22.3a).
The progressive and retrograde series (in dark
grey and light grey respectively; Figure 22.3b)
suggest that the precipitation started to decrease
in 1973, but the intersection point of the two
indicates that 1978 represented the beginning
of a statistically meaningful downward trend.
However, the decreasing trend did not cover the
entire period; for example, in 2005 the progressive
series exceeded the statistically significant level (t
=
1.96), indicating a temporary reversal caused by
an unusually wet year.
Hydrological modelling
Comparison of field measurements for discharge
taken in the study site with modelled outputs
using the automatic probe, weather station and
in situ
measurements indicated that the SWAT
Figure 22.3
a) Annual variability of
mean precipitation in the Pardiela
catchment during 1932-2007. The
dashed line represents the average
precipitation during the period
1961-1990 (data from the Azaruja
and Santa Susana meteorological
stations). b) Progressive (dark grey)
and retrograde (light grey) series of
Mann-Kendall statistic test. The
dashed lines represent the significance
boundaries (t
=
1.96;
=
0.05).