Graphics Reference
In-Depth Information
0
5
10
15
20
25
30
35
Index
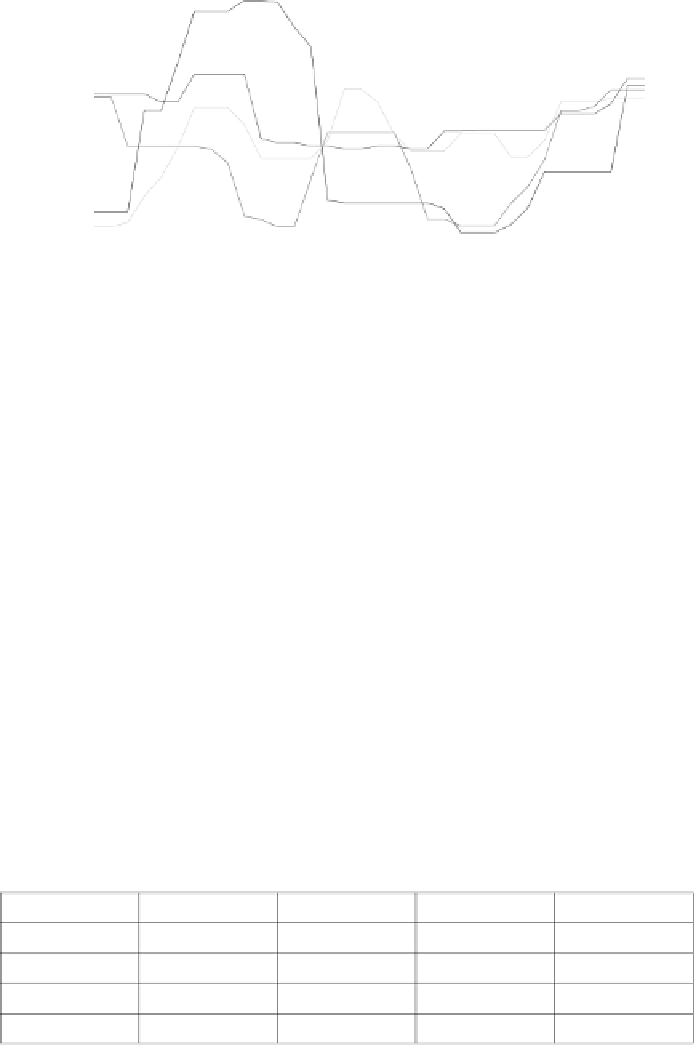
Figure 2.
Traces of speech activity for all four participants in Figure 1, showing average
head movement for each minute of the 30-minute conversation (units represent pixel shift).
Note only a brief low from two members at the start and again between minutes 23 and 25,
otherwise the majority are active at all times, with two peaks—the fi rst at around 10 minutes
and the second between 15 and 20 minutes.
(Color image of this fi gure appears in the color plate section at the end of the topic.)
confirm a high level of joint speech activity throughout the entire
conversation.
Figure 2 plots averaged head movement, for each minute from the
camera data illustrated in Figure 1, for each of the four participants
across the whole conversation. Distinct peaks of high activity reveal
those times when a given speaker is particularly dominant in a
conversation, but it is noticeable that with the exception of two brief
periods, all participants remain highly active throughout, taking a
contributory role in the whole of the conversation. All participants rise
to an almost equal level of activity towards the end of the recording
when the session comes to a close.
Table 1 shows the correlations between measures of the head
activity of the four speakers shown in Figures 1 and 2. The synchrony
is confirmed to be highest for participant 3, whereas participant 2
Table 1.
Correlations of head activity between all participants (from summed data for
each of the 30 minutes). This tabulates the data shown in Figure 2.
Speaker
1
2
3
4
1 (red)
-
0.107
0.335
0.207
2 (blue)
0.107
-
0.117
0.094
3 (green)
0.335
0.117
-
0.353
4 (brown)
0.207
0.094
0.353
-

Search WWH ::

Custom Search