Graphics Reference
In-Depth Information
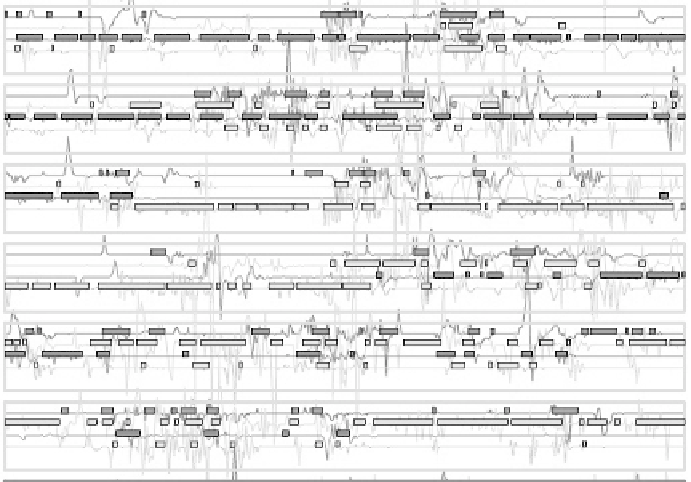
Figure 1.
Traces from a multimodal conversation of four participants (color-coded to show
speaker id), with the solid horizontal bars indicating speech activity and the lines plotting
vertical head movement. Each row represents data from one minute of speech.
(Color image of this fi gure appears in the color plate section at the end of the topic.)
We see that while a single speaker appears to dominate in all but
one one-minute slice of the action, the other 'listeners' are also active
throughout. For the first two minutes, speaker 1 (voice activity coded
by grey bars) dominates, and for the third and fourth minutes, speaker
2 (coded by green) dominates, to be replaced by speaker 3 (coded by
yellow) for the remaining two minutes. It is clear, however, that no
one in the conversation remains passive during these times. Every
row shows overlapping activity, and the majority show all participants
offering brief contributions throughout. Row 5 is more fragmented
and this particular pattern of joint activity (representing laughter) is
frequently observed throughout the corpus (Campbell, 2006). This high
level of joint activity from all participants throughout each minute of
the conversation reflects the social nature of the interaction, which is
not well matched by the strict turn-taking and text-based articulation
expected in many current automated spoken dialogue systems. This
is multi-party interaction, and two-party dialogue is a special case of
this wider norm but similar principles apply: the listener is expected to
take an active role in the dialog, not just answering when questioned,
but contributing to the discourse throughout. Figure 2 plots data that
Search WWH ::

Custom Search