Biomedical Engineering Reference
In-Depth Information
0
2
4
300
m
µ
[
m]
µ
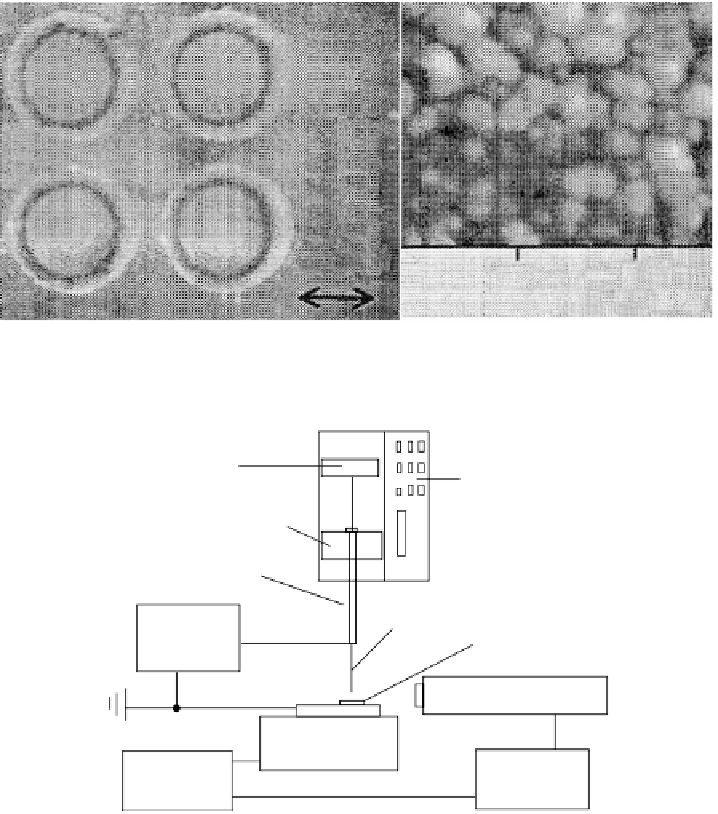
FIGURE 11.38
SEM images of electrosprayed protein spots. (From Lee, B. et al.,
J. Chem. Eng. Jpn
, 36,
1370, 2003. © Society of Chemical Engineers, Japan. With permission.)
Pusher
block
Pump
Syringe holder
Syringe
Capillary
Power
supply
Substrate
Microscope CCD
X
−
Y
−
Z
stage
Motion
controller
Computer
FIGURE 11.39
A schematic diagram of electrospraying for producing microarrays. (Reprinted from
Moerman, R. et al.,
Anal. Chem.
, 73, 2183, 2001. © American Chemical Society. With permission.)
more than 400 µm, which stopped the spraying instantaneously. Then, a rapid shift of the substrate
sideways and a decrease of the electrospraying distance were performed to resume the electro-
spraying again, because of the increased electric fi eld strength, which resulted in the deposition of a
second spot. A microarray biochip can be manufactured by repeating the process automatically. A
schematic diagram of the setup is shown in Figure 11.39. The syringe displaced liquid through the
connected stainless steel capillary, which was connected to a power supply. The aluminum substrate
fi xed on a grounded metal holder was accurately positioned and moved relative to the capillary using
an
X-Y-Z
table. Solutions containing biological materials were electrosprayed in the form of spots
by repeatedly moving the substrate 100 µm downward (spraying stops), 400 µm sideways (to the
next target area in
150 ms), and 100 µm upward (spraying), as shown in Figure 11.40. The applied
voltage and the fl ow rate were kept constant during the electrospraying of array spots. The spot diam-
eter was mainly determined as a function of the fl ow rate, liquid properties, applied voltage, spraying
distance, and deposition time.
Figure 11.41 shows the microarrays of uniform spots that were prepared by electrospraying
a liquid solution consisting of 20 U/mL of lactate dehydrogenase (LDH), 0.5 wt.% of trehalose,
<