Geology Reference
In-Depth Information
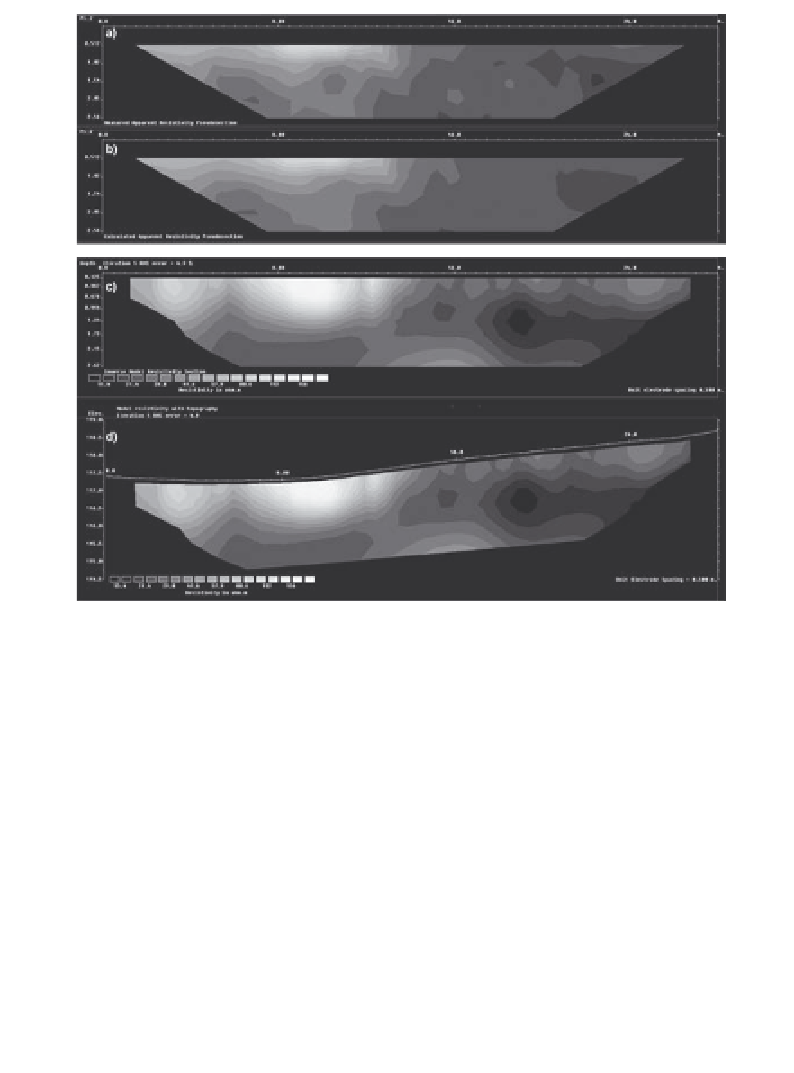
Figure 6.11
(a) Wenner array apparent resistivity pseudo-section. (b) Cal-
culated apparent resistivity pseudo-section derived from (c), the true resis-
tivity model, also displayed (d) in relation to the actual topography, with a
2:1 vertical exaggeration. Dark colours indicate high resistivity. The high-
resistivity region near the break of slope is a former clay pit, infilled with
rubble and other industrial waste.
The maximum depth of an ERI investigation is determined by the fun-
damental spacing between the electrodes and by the number of electrodes
in the array. For a 64-electrode array with an electrode spacing of 2 m, this
depth is approximately 20 m, but depends on ground resistivity. At any one
site, fewer and fewer points are collected at each 'depth level' as the spac-
ing between the active electrodes is increased, until at the final level only
a single reading is obtained. To counteract this effect, the array must be
'rolled-along' the line of investigation. The additional line length needed
to get the required coverage at the depth of interest can have a significant
impact on productivity, and is an essential factor in survey design.