Geology Reference
In-Depth Information
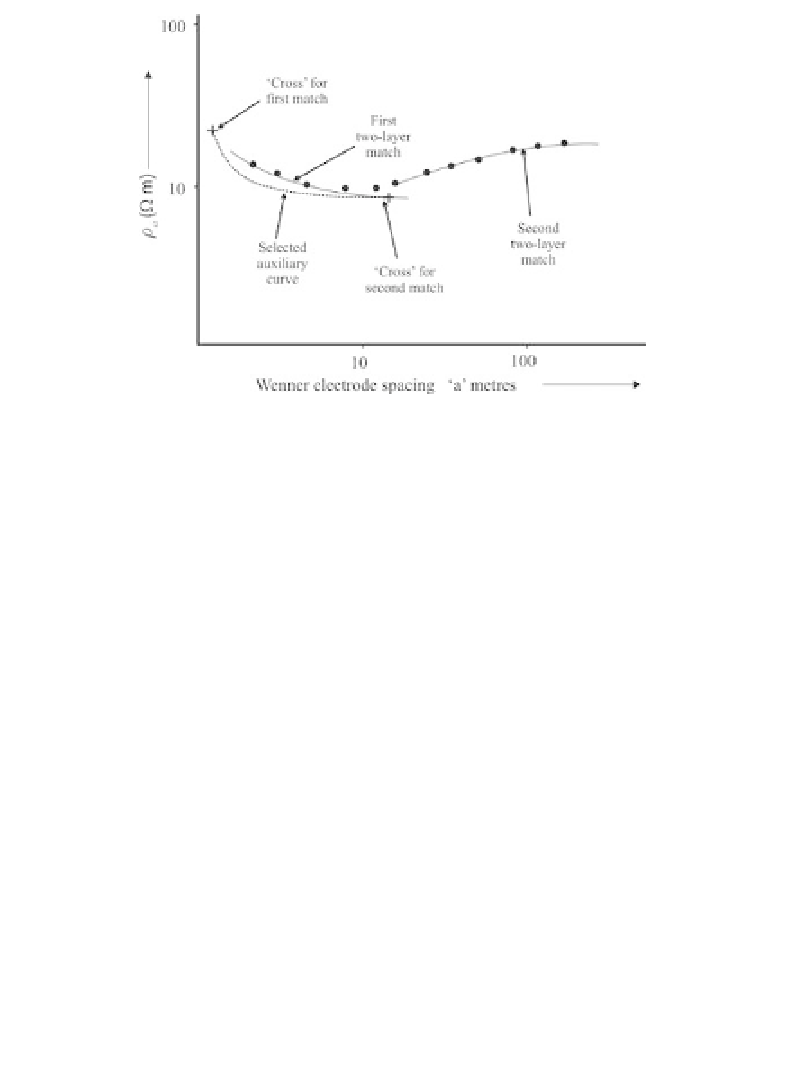
Figure 6.10
Sequential curve matching. The curve produced by a low-
resistivity layer between two layers of higher resistivity is interpreted by
two applications of the two-layer curves of the type shown in Figure 6.7. In
matching the deeper part of the curve, the intersection of the
a
/
h
=
1
and
ρ
α
/
ρ
1
=
1
lines (the 'cross') must lie on the line defined by the auxiliary
curve.
tomography (ERT), but ERT in North America is generally used only for
measurements made using multiple parallel strings of electrodes, with elec-
trodes selected in pairs from different strings. The data are then treated using
tomographic reconstruction techniques. This is consistent with the mean-
ing of tomography in both medical and seismological imaging, and for this
reason is the definition favoured by the authors. The term electrical resistiv-
ity imaging (ERI) is here used specifically for resistivity data acquired using
a single multi-electrode cable.
ERI data are collected along a traverse at a number of different separations
that are multiples of a fundamental spacing. As shown in Figure 6.11,
the results can be displayed as contoured
pseudo-sections
that give rough
visual impressions of the way in which resistivity varies with depth. The
data can also be
inverted
using finite element and least-squares inversion
methods to produce so-called true resistivity sections with vertical scales in
depth rather than electrode separation, giving more realistic images of actual
resistivity variations. As a result of the increasing use of these techniques,
the inadequacies of simple depth sounding have become much more widely
recognised.