Information Technology Reference
In-Depth Information
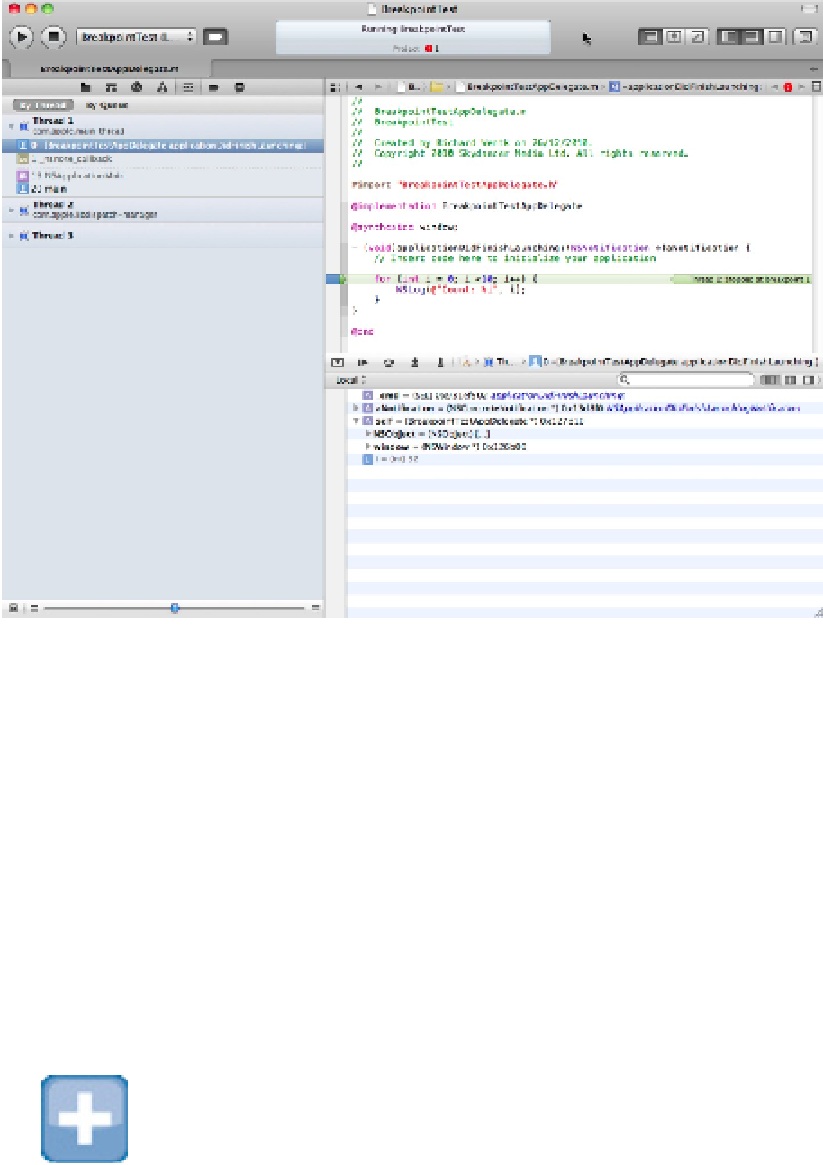
Examining the state of the application at a breakpoint
In this example, use the Step Over button to continue the count manually. You see the code cycling between the
first line of the
for…
loop and the second line. The value of the
i
loop counter increases with each repeat.
When
i
is 9 on the last repeat, the final Step Over takes you to the end of the method. If you Step Over again,
you see an assembly listing of the method dispatch code in the Objective-C runtime. This is OS internal code.
Although you can continue stepping through it statement by statement, this isn't usually a useful thing to do.
Enabling and disabling breakpoints
You can disable an individual breakpoint by clicking its gutter arrow, which becomes translucent. A disabled
breakpoint remains in place but is ignored by Xcode. (It also keeps its settings, which are described below.)
You can also disable all breakpoints by clicking the main Debug arrow at the top left of Xcode. This turns off
debug mode globally. As before, all breakpoints remain in memory, and they are saved as part of the project. But
when Debug Mode is disabled globally, Xcode ignores them.
TIP
You can click any breakpoint and drag it to move it.
Using the Variables View