Information Technology Reference
In-Depth Information
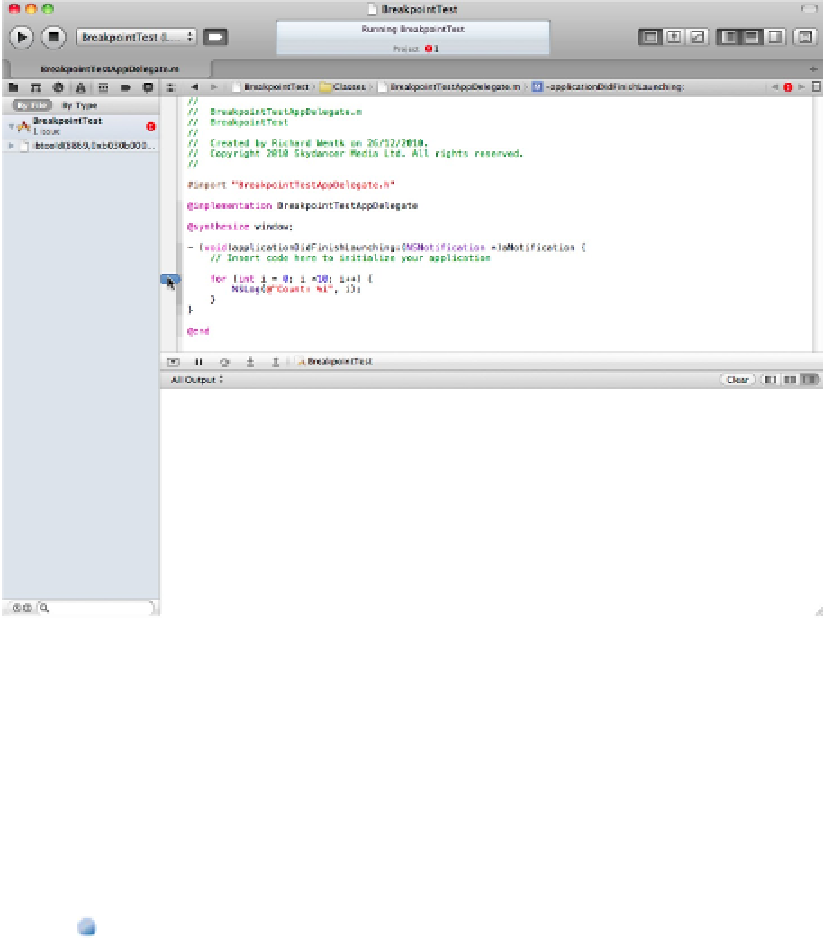
Build and run the application again. This time the run pauses automatically at the breakpoint, with the display
shown in Figure 15.11. The breakpoint is highlighted in the code editor, the Debug Navigator appears at the
left, and the Variables View appears at the bottom of the screen. You can now use the Variables View, described
in more detail later, to examine objects, or you can continue to step through the code by hand.
Continuing after a breakpoint
When Xcode pauses at a breakpoint, you can use the toolbar to control how execution continues. The buttons
have the following functions:
Show/Hide Debug area:
Click this to show or hide the debugging area at the bottom of the screen. This
option is equivalent to the show/button in the toolbar at the top right of Xcode.
Continue:
Click this to run the application from the point at which it paused. It continues to run until
it's terminated or it encounters a breakpoint.
Step Over:
This executes the current line and stops at the next. This is equivalent to the single-step op-
tion in other debuggers.
Step Into:
This steps into a method or function. By default, Xcode runs a method or function without
stepping into it; you see the result, but you can't step through each line of the code. Use this option when
you want to examine what happens inside the method or function.
Step Out:
This steps out of the current method or function—in other words, it runs to the end or re-
turns—and then it steps in the calling function or method. If there is no calling function or method, this
option steps out to an assembly listing of the OS internals.
FIGURE 15.11