Information Technology Reference
In-Depth Information
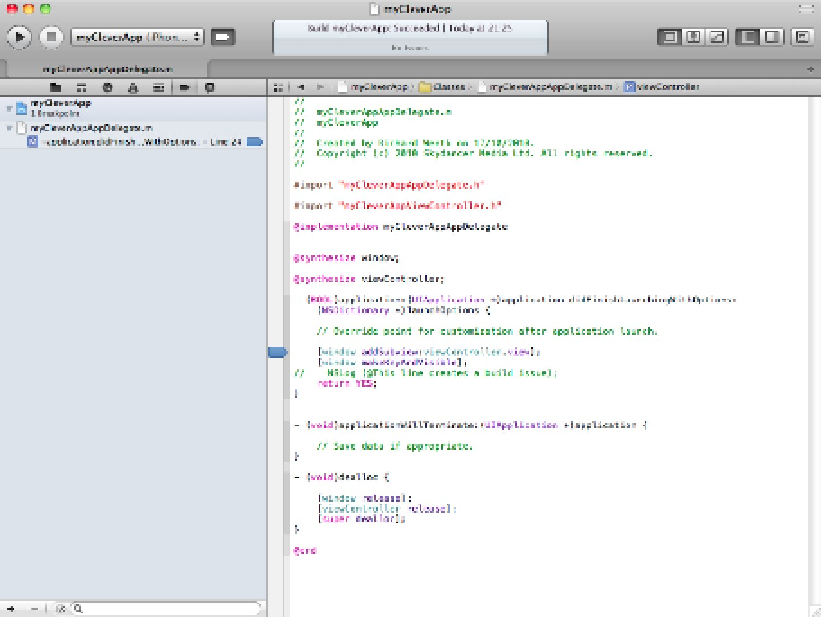
The Debug Navigator, shown in Figure 4.16, lists active threads after a breakpoint is triggered. A separate debug
area at the bottom of the screen appears automatically and displays relevant values and objects. For a detailed
example of debugging with breakpoints, see Chapter 15.
Loading the navigators from menus and keyboard shortcuts
You can access all the navigators from Xcode's menu tree or via keyboard shortcuts. The Navigators are listed
under View⇒Navigators. To select them from the keyboard, use
Ô
+1-7.
Ô
+0 shows/hides the navigator area.
FIGURE 4.16
Viewing breakpoint and thread information in debug mode, with the Debug Navigator