Environmental Engineering Reference
In-Depth Information
Table 6.11
Techno-economical results of cogeneration technologies
TCOPF case
Micro-CHP generation (MWh
el
)
Time of peak generation (
h
)
1
N/A
N/A
2
4.20
7 p.m.
3
3.92
10 p.m.
4
3.92
5.30 a.m.
5
11.82
Morning and midday
6
19.34
Constant all day
7
19.34
Constant all day
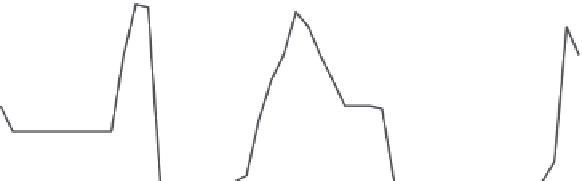
different formulations. Likewise, employing the same legends as Figures 6.8 and
6.9 to explain the results, Figure 6.10 describes the different aggregated micro-CHP
generation profiles obtained from running the various simulations.
The following conclusions can be drawn from the micro-CHP operation results:
Although cases 2, 3 and 4 produce approximately the same amount of distributed
generation, their production is not as abundant as cases 5-7. Therefore, the
technology is underutilised due to its operating features described in Table 6.2;
●
Although case 5 focuses on loss reduction, the use of cogeneration facilities is
greater for it than for cases 2, 3 and 4; this is achieved by charging the thermal
storage facilities during moments of low demand and discharging them when
convenient;
●
Cases 6 and 7 have the same results, clearly obtaining the most benefit from CHP
production. The motive is quite simple; these scenarios create an environment
●
Aggregated micro−CHP generation profile
1
2
3
4
5
6
7
0.8
0.6
0.4
0.2
0
2
4
6
8
10
12
14
16
18
20
22
24
Time (h)
Figure 6.10
Aggregated micro-CHP generation profiles from the TCOPF operating
strategies


Search WWH ::

Custom Search