Biology Reference
In-Depth Information
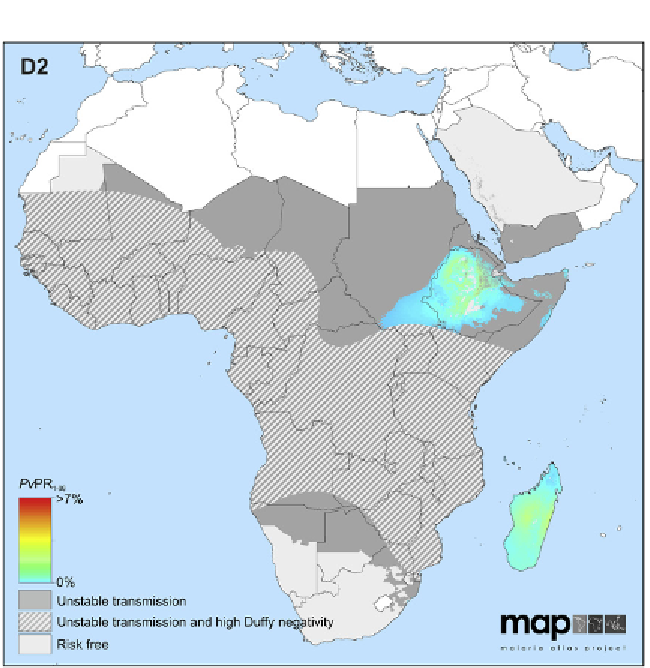
Figure 1.3, cont'd
otherwise well suited for transmission (
Guerra et al., 2010
). We incorpo-
rated recent global estimates of the frequencies of Duffy negativity (
Howes
et al., 2011
) in our model. Regional maps of the predicted prevalence of
Duffy negativity are shown in
Fig. 1.7
. The fraction of the population at
each population that was Duffy-negative was excluded from the denomi-
nator in the prevalence data, such that any
P. vivax
-positive individuals are
assumed to have arisen from the Duffy-positive population subset. Thus, in
a location with 90% Duffy negativity, five positive individuals in a survey
of 100 would give an assumed prevalence of 50% amongst Duffy posi-
tives. Correspondingly, prediction of prevalence was then restricted to the
Duffy-positive proportion, with the final prevalence estimate re-converted
to refer to the total population. This approach meant prevalence could never
exceed the Duffy-positive proportion of a population and, where
P. vivax