Geoscience Reference
In-Depth Information
SRES A1B scenario [
Arzel et al.
, 2006]. The CCSM3 model
simulates close to the observed sea ice changes during the
20th century and predicts the most drastic sea ice loss during
the 21st century when compared to other models. Already
by 2040, CCSM3 predicts that majority of the Arctic basin
will be ice free in September.
Holland et al.
[2006] linked
the drastic sea ice decline in the CCSM3 model to increased
oceanic heat flux, which triggers the ice-albedo feedback by
melting large areas of sea ice. Below we demonstrate that
cloud changes also play an important role in sea ice decline.
The results are based on one realization (run 1) of a group of
seven ensemble members from the SRES A1B simulations.
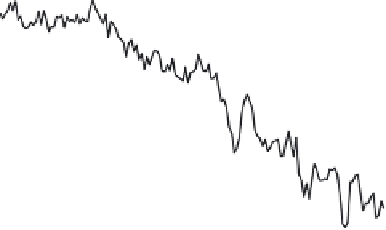
Figure 8 shows the annual mean sea ice concentration av-
eraged north of 70°N simulated by CCSM3 from 1950 to
2100. The model simulates SIC decrease from about 50% in
1950 to 45% in 2000 and 25% by 2100. The sea ice decline
is accompanied by significant warming of the atmospheric
boundary layer and a strong increase in the cloud liquid wa-
ter content: the model predicts a 5 k increase in the bound-
ary layer air temperature and about 50 g m
-2
increase in the
cloud liquid water path during the 21st century (Figure 9a).
As discussed in the previous sections, the increase in cloud
liquid water path increases cloud optical thickness and thus
increases both the cloud SW cooling and LW warming. At
the same time, cloud effect on the downwelling LW flux has
an additional strong contributing factor: increase in the near-
surface air temperature.
Figure 9b disentangles the surface albedo and cloud effects
on the shortwave radiation and compares cloud effects on the
shortwave and longwave radiative fluxes. The thin black line
represents the difference between the annual mean values of
reflected radiation from 1950 to 2100 and the 1990-1999 av-
erage denoted in the equations below by
90
(in Figure 9b
values of the reflected flux are multiplied by minus showing
anomalies in absorbed radiation due to surface albedo):
x y
'
SW
n
SW
n
SW
n
90
SW
p
D
s
SW
p
D
s
90
(1)
where
SW
is reflected SW flux,
SW
¯
is downwelling SW
flux, and a
s
is surface albedo.
The thick black line in Figure 9b represents the anomalies
in the net SW flux with respect to the 1990-1999 average:
'
SW
net
SW
net
SW
net
90
=
SW
¯
(1-a
s
)
SW
¯
(1-a
s
)
90
-
=
SW
¯
-
SW
¯
a
s
-
SW
¯
90
+
SW
¯
a
s
90
.
(2)
The difference between the anomalies in the net absorbed
SW flux (D
SW
net
) and the anomalies in the absorbed radia-
tion due to surface albedo (-D
SW
), that is the difference
between thin and thick black lines in Figure 9b, shows by
how much clouds offset the increase in the absorbed SW
radiation at the surface:
'
SW
net
'
SW
n
SW
p
SW
p
90
(3)
The sea ice decline lowers the surface albedo, which
decreases the surface reflected SW flux. If no changes in
clouds occurred, the surface would gain about 42 W m
-2
more during the summer months in 2100 compared to the
1990s because of the surface albedo drop (thin black line in
Figure 9b). At the same time, less shortwave flux reaches
the surface because of the larger cloud liquid water path.
This cloud effect offsets but does not cancel the increase in
the net SW flux due to the strong drop in the surface albedo.
Increase in cloud reflectivity reduces the actual gain in the
net SW by 2100 compared to the 1990s to about 18 W m
-2
(thick black line in Figure 9b). At the same time, larger cloud
liquid water path increases the cloud longwave emissivity,
while warmer atmospheric temperatures increase the effec-
tive emitting temperature. This leads to a significant increase
in the downwelling longwave flux (grey line in Figure 9b).
The yearly average increase in the downwelling LW flux by
2100 compared to the 1990s is as high as 34 W m
-2
, which
is almost twice the magnitude of the net SW flux increase
during the summer.
Figure 10 compares seasonal cycles in cloud LWP and
boundary layer atmospheric temperature during the first
and last decade of the 21st century, and Figure 11 shows
Figure 8.
Annual mean sea ice concentration averaged over the
ocean north of 70°N from the NCAR CCSM3 model. Data during
1950-1999 are from the Climate of the 20th Century Experiment
(20C3M) simulations run 1, and data during 2000-2100 are from
the SRES A1B simulations run 1, performed as part of IPCC AR4.


Search WWH ::

Custom Search