Geoscience Reference
In-Depth Information
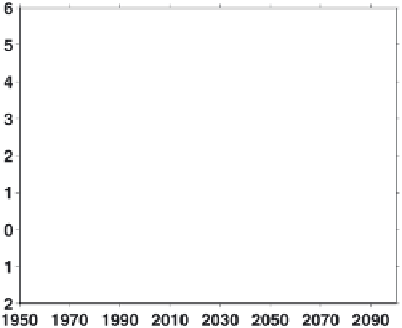
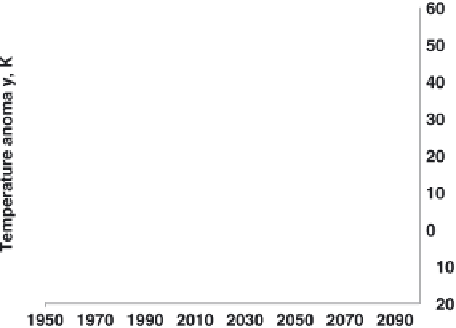
Figure 9.
Anomalies relative to 1990-1999 in (a) air temperature (T) averaged for 850 and 925 mbar pressure levels
(thick line) and cloud liquid water path (LWP) (thin line) and (b) May-August mean decrease in the surface reflected
shortwave flux (thin black line), May-August mean surface absorbed shortwave flux (thick black line), and annual mean
downwelling longwave flux (grey line) simulated by the NCAR CCSM3 model averaged over the ocean north of 70°N.
Data during 1950-1999 are from the 20C3M simulations run 1, and data during 2000-2100 are from the SRES A1B
scenario simulations run 1, performed as part of IPCC AR4.
ter months, when clouds contain smaller amounts of liquid
compared to summer (Figure 10a). As discussed in the pre-
vious section, downwelling LW flux is strongly influenced
by increasing LWP for thin clouds. This allows the increased
LWP during winter months to have a noticeable effect on the
downwelling LW flux (Figure 11a).
In addition to increase in cloud LWP, the atmospheric
layer from 1000 to 850 mbar, where low stratus clouds usu-
ally reside, warms up significantly during the entire year but
especially strongly during the winter (Figure 10b). Warming
the effect of these cloud properties changes on the surface
radiative fluxes. CCSM3 simulates high amount of liquid
water in Arctic clouds during the entire year compared to
ground-based observations performed during SHEBA from
1997 to 1998 [
Gorodetskaya et al.
, 2008]. Its monthly aver-
age LWP exceeds the threshold value for cloud saturation in
both SW and LW radiation (about 30 g m
-2
), especially dur-
ing summer months (Figure 10a). This is limiting the impact
of increasing cloud LWP on SW cloud forcing. The largest
increase by year 2100 in LWP is predicted during the win-
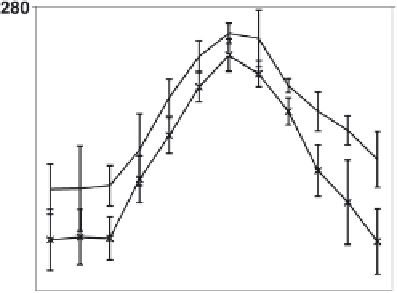
Figure 10.
Seasonal cycles during 2000-2010 and 2090-2100 of (a) cloud liquid water path (LWP) and (b) air tempera-
ture averaged over 1000, 925, and 850 mbar pressure levels simulated by the NCAR CCSM3 model forced with SRES
A1B scenario and averaged over the ocean north of 70°N. The error bars for the model output are standard deviations
based on monthly means. SHEBA data are monthly averaged LWPs based on daily values available from October 1997
to September 1998. SHEBA error bars are standard deviations based on daily values.


Search WWH ::

Custom Search