Geoscience Reference
In-Depth Information
Figure 5.
Annual cycle of (a) shortwave surface cloud forcing (SW flux SCF) and (b) longwave surface cloud forcing
(LW flux SCF) for the downwelling (solid line), upwelling (dashed), and the net flux (dash-dot). Year day (1997) zero
is defined as 1 January 1997, 0000 LT. Year days for 1 December, 1 March, 1 June, and 1 September are 335, 425, 517,
and 609, correspondingly (adapted from
Intrieri et al.
[2002a]).
temperatures can be located within the cloud rather than at
the cloud base [
Stramler
, 2006].
Presence of liquid in Arctic clouds substantially increases
their impact on both the SW and LW fluxes [
Shupe and In-
trieri
, 2004;
Zuidema et al.
, 2005]. The annual mean LW
(SW) cloud forcing with respect to the net surface fluxes was
estimated at 52 (-21) W m
-2
for liquid-containing clouds
compared to 16 (-3) W m
-2
for ice-only clouds [
Shupe and
Intrieri
, 2004]. The time mean cloud optical thickness of liq-
uid clouds is estimated at 10.1 ±
7.8 corresponding to LWP
of 37 g m
-2
. This by far exceeds the mean optical thickness
for ice-only clouds of 0.2 [
Zuidema et al.
, 2005]. Similarly,
in mixed phase clouds, the cloud liquid content dictates
cloud optical thickness [
Zuidema et al.
, 2005].
For both LW and SW radiative fluxes, cloud optical thick-
ness has a threshold value above which further increase in
the liquid water path has no influence on SW or LW cloud
forcing. Clouds become saturated in the LW at lower values
of LWP than in the SW; that is, as LWP increases, the cloud
SW cooling effect continues to increase after the LW warm-
ing effect reaches saturation (clouds emit as blackbodies
regardless of further increase in LWP) [
Shupe and Intrieri
,
2004]. To compute cloud SW forcing as a function of cloud
LWP over a reflective surface is difficult as cloud SW forc-
ing also depends on the downwelling solar radiation and sur-
face albedo. Monthly mean LWP at SHEBA is about 10-20
g m
-2
during the winter and increases to 90 g m
-2
by the
end of summer [
Gorodetskaya et al.
, 2008]. Low sensitivity
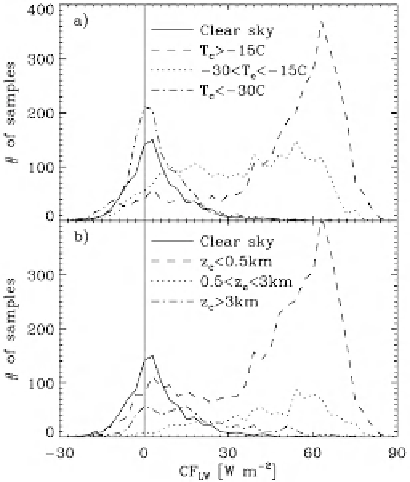
Figure 6.
Distribution of the longwave cloud forcing (CF
LW
) de-
fined as difference between net surface LW fluxes for all-sky and
clear-sky conditions distinguished by (a) cloud base temperature
and (b) cloud base height. The clear-sky distribution (an uncer-
tainty estimate for these calculations) is also shown in both Figures
6a and 6b. From
Shupe and Intrieri
[2004], with permission of the
American Meteorological Society.


Search WWH ::

Custom Search