Geoscience Reference
In-Depth Information
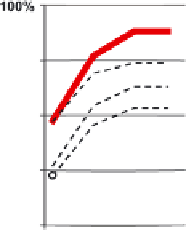
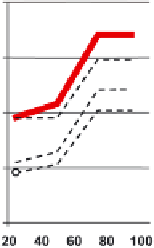
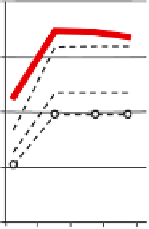
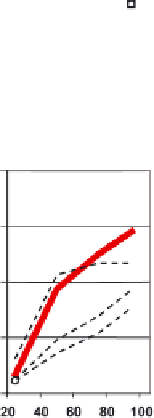
Plate 6.
Probability of “extinct” outcome projected by Bayesian network (BN) model of worldwide polar bear popula-
tions. Shown are probabilities provided by the mean of a 10-member ensemble of general circulation models and the
individual models which leave the maximum and minimum amount of sea ice at each time stop. Red line illustrates
extinction probabilities from Table 2. Open circles illustrate results from setting all possible on the ground human influ-
ences to more favorable for bears than they are now. Solid circles illustrate holding all on the ground human influences
as they are now. Squares illustrate results when all inputs, except ice nodes N, B and C, are held to uniform probabilities
(i.e., total uncertainty). Only in the AE and PBCE does it appear that manipulating on the ground human activities can
substantively influence overall outcomes at mid century and beyond.


Search WWH ::

Custom Search