Geoscience Reference
In-Depth Information
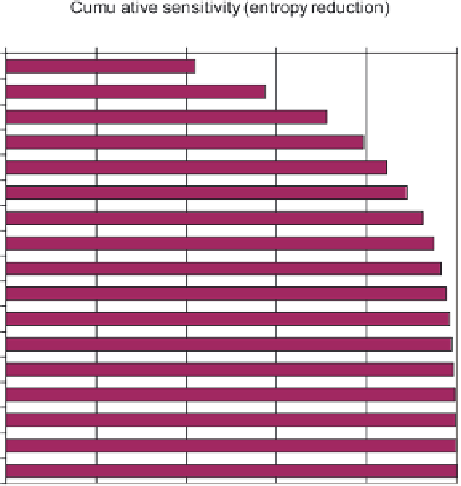
Plate 5.
Cumulative sensitivity of overall population outcome (node D1, Plate 3) to all input variables (yellow boxes,
Plate 3) in the Bayesian network population stressor model. The 17 input variables on the vertical axis are listed, top to
bottom, in decreasing order of their individual influence on overall population outcome (see Appendix C, sensitivity test
1). The horizontal axis represents the cumulative proportion of total entropy reduction (mutual information) from the in-
put variables. For example, the first two variables, foraging habitat quantity change and foraging habitat absence change,
together explain 58% of the variation or uncertainty in the overall population outcome.


Search WWH ::

Custom Search