Geoscience Reference
In-Depth Information
nify cases shown in Figures 12a - 12d, respectively. The thin
solid lines contour
A
e
(
H
c
) in increments of 0.1
A
max
, whereas
the dashed contours indicate positive
H
c
in increments of
2 W m
-2
. Zero values for both quantities, indicated by the
heavy solid contours, divide the parameter space into three
regimes. In regime I, the bifurcation at
H
c
occurs formally
at
A
e
< 0 but is not realized because of clipping at the mini-
mum physical value
A
e
= 0 . Thus, as
H
increases,
A
e
ap-
proaches zero continuously, without an abrupt transition, as
in Figures 12a and 12c. This regime is realized under high
values of
F
and thus could be viewed (within the limitations
of this model) as representing behavior under colder climatic
conditions such as the last Glacial Maximum. by contrast,
in regime II, an abrupt transition from
A
e
(
H
c
) > 0 to
A
e
= 0
occurs as
H
increases through
H
c
>
0 as is evident in Fig-
ure 12b and Figure 12d. For CCSM3 parameter values the
system lies within this regime, so that hysteretic transitions
between multiple equilibria occur for
H
> 0 as shown previ-
ously in Figure 9.
Regime III characterizes a situation in which the transition
from
A
e
to
A
e
occurs for
H
< 0, so that for the
H
³ 0 regime
that is of interest here only the
A
e
= 0 equilibrium is realized.
This case is not considered further.
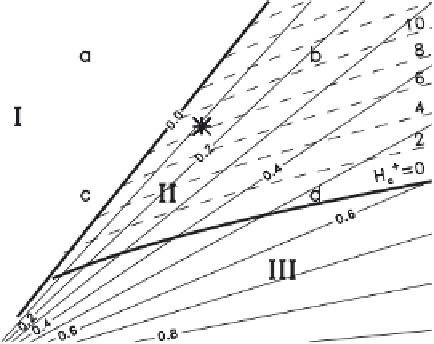
Figure 11.
Properties of the hysteretic transition from
A
e
> 0 to
A
e
= 0 as in Figure 9b, as functions of parameters
F
and
b
with
other parameters assigned CCSM3 values listed in Table 2. Thin
solid contours denote summer ice extents
A
e
> 0 (scaled by
A
max
) at
which the transition occurs (contour interval 0.1), and thin dashed
contours denote the corresponding critical ocean heat transports
H
c
. The (thick) zero contours of both quantities divide the plane
into three regimes, as discussed in the text. The asterisk indicates
(
F
,
b
) characterizing CCSM3, and the letters a - d indicate values of
(
F
,
b
) in Figures 12a - 12d, respectively.
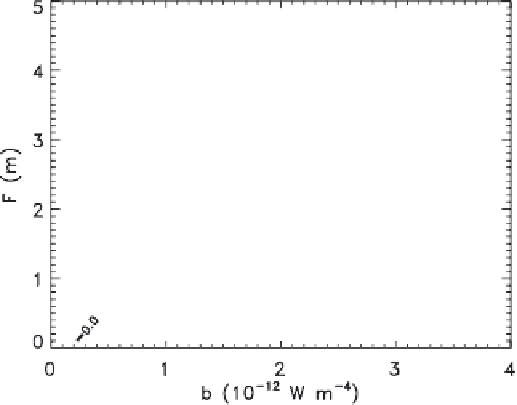
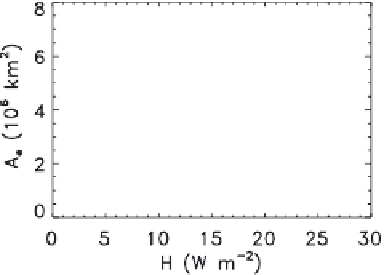
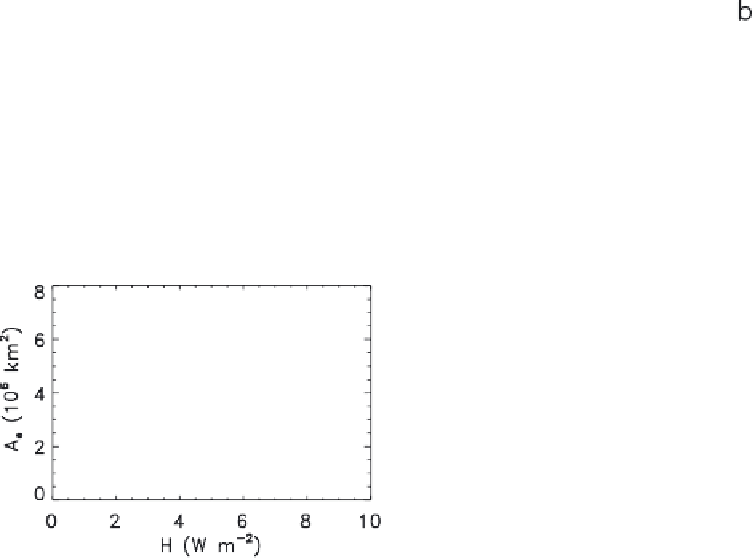
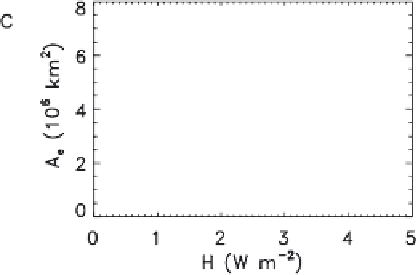
Figure 12.
Equilibria
A
e
of summer ice extent, as a function of
H
, for parameter values
F
and
b
: (a) (4.2 m, 1 ´ 10
-12
W
m
-4
), (b) (4.2 m, 3 ´ 10
-12
W m
-2
), (c) (2.2, 1 ´ 10
-12
W m
-2
), and (d) (2.2, 3 ´ 10
-12
W m
-2
), indicated by corresponding
letters a - d in Figure 11.


Search WWH ::

Custom Search