Biomedical Engineering Reference
In-Depth Information
between two peaks, the user obtains the average height difference between the two
corresponding features. This analysis method should be used with caution, however.
Although it has some advantages over other methods of measuring height differences
between layers (see Section 5.3), it is very sensitive to the quality of the levelling,
because poor levelling will tend to bring the peaks in the histograms closer together.
In addition to histogram stretching functions, many AFM software packages con-
tained brightness and contrast adjustment controls. These essentially perform the
same functions as the histogram adjust function, but with somewhat less fine control
over the result. Usually the AFM software will remember the whole resolution of the
AFM image when performing histogram adjustment, but some software packages are
set up to discard the extra data when a colour scale adjustment is made in this way,
so the function should be used with caution if this is the case, as the data outside the
new colour range could be lost.
5.2.2 Colour palettes
The colour palette used to display an AFM image can be selected to make the image
seem more visually compelling. In some cases, selecting a specialized colour pallet
can help with visualizing certain aspects of an image. For example, in the previous
section, the special case of images with features of dramatically different heights was
mentioned. While stretching the colour histogram to cover one set of features
increases contrast on that feature, other features in the image lose contrast. By
using a palette with more than one colour gradient, features at more than one height
can be displayed while maintaining high contrast. This works because although the
human eyes can distinguish less than 100 brightness levels of a particular colour, the
combination of different shades allows many more to be distinguished [353]. An
example of a case where a complex palette is useful is given in Figure 5.6. However,
apart from the use of multiple colour gradients, the choice of the colour palette that
is used for displaying an AFM image is very subjective.
46 nm
0 nm
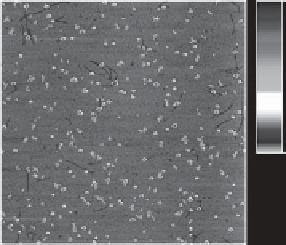
Fig. 5.6. Example of the usefulness of complicated colour palettes. In this image, the various
shades allow features of different heights to be seen at the same time. Here, gold nanoparticles are
seen in red and yellow, DNA in white, a salt layer in light blue and the substrate in dark blue.
(A colour version of this illustration can be found in the plate section.)