Biomedical Engineering Reference
In-Depth Information
25 nm
6000
5000
4000
3000
2000
1000
0
0 nm
0
5
10
Height / nm
15
20
2.1 nm
10000
8000
6000
0 nm
4000
2000
0
0.0
0.5
1.0
Height / nm
1.5
2.0
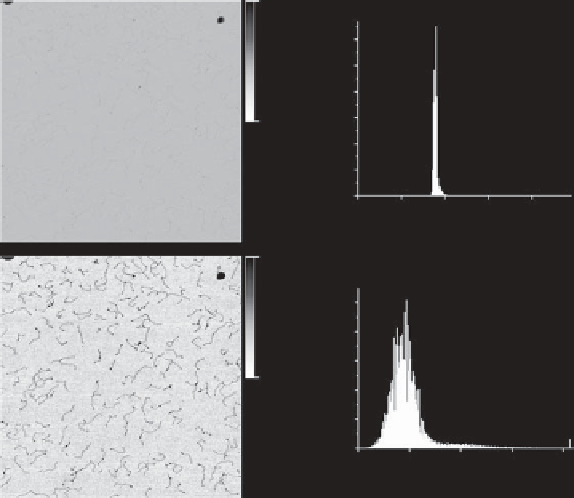
Fig. 5.5. Example of histogram adjustment. In the upper case, the data is mostly concentrated in the
centre of the histogram; the image shows little detail. In the lower case, the colour range was adjusted
so the data stretches over more of the available colour range; the features of interest (DNA
molecules) are much clearer. The position of the
y
axis
0 nm height has also changed.
scale to cover the entire range of the
z
scale. If the user examines the histogram of height
values, they often observe that 90% or more of the data is squashed into a narrow region of
the histogram. This is often the case because of small amounts of outlying data points (i.e.
very low or very high parts of the topography). These outlying regions may reflect real
topographical features, but are sometimes caused by errors or glitches in the data. In either
case, using a histogram adjust tool, the user may decide to reject upper and/or lower points
from the colour scale, so that the colour scale is better distributed over the majority of the
height data. This has the effect of greatly increasing the contrast in the majority of the
image, and often helps greatly to visualize finer details in the image. An example of this
use of the histogram adjust function is given in Figure 5.5.
The height histogram can be useful for other functions apart from redistribution of
image colours. For randomly varying topography, the histogram will usually display
an approximately Gaussian distribution of heights. Deviations from the typical shape
give information about the distribution of heights in the image. For samples with two
significantly different regions, for example, there will be two peaks in the histogram.
A staircase-like sample with various flat levels at different heights will give rise to
further peaks. To selectively enhance the contrast on one of the two features, the user
simply stretches the colour scale across the relevant peak in the histogram. The
histogram tool can also be used for analysis-for example by measuring the distance