Global Positioning System Reference
In-Depth Information
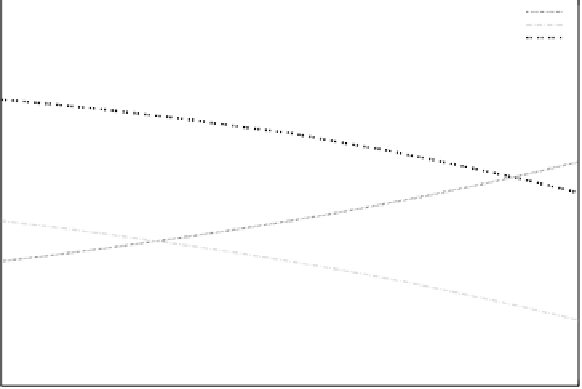
Variability
1
w
att
w
part
GC
0.9
0.8
0.7
0.6
0.5
0.4
0.3
0.2
7
11
15
19
23
27
31
Parts
Fig. 9.
GC
v
and variability parameters by varying parts' occurrences
Color image of this figure appears in the color plate section at the end of the topic.
variability of parts decreases. Consequently, the variability of attributes
increases, and the related commonality decreases. In this case, commonality
and variability highlight parts.
Comparing methods
We apply the experiments shown in the previous subsection to
Lin
,
Dice
and
MDSM
similarity methods as well in order to contrast the
GSim
method
against them. To this end, fi rst we compare their correlation achieved by
changing the occurrences of attributes, which are shown in Table 6 and
Fig. 10. We observe that the correlation of
GSim
c
with human judgment is
always higher than the correlation achieved by applying other methods. In
particular, the correlations obtained by applying
GSim
v
, and
GSim
c
are better
than
MDSM
v
,
MDSM
c
, respectively, and in most cases the ones obtained
by
Dice
is worse than the others. The reason is that in
Dice,
an exact feature
(or attribute) matching approach is adopted, which essentially relies on the
cardinalities of the intersection and/or union of the comparing features.
In the case of lower occurrences of attributes (i.e., 15, 17 in Table 6), which
represent lower number of shared features, the correlations by
Dice
are
even less than 0 (i.e., -0.1539, -0.1021). It is interesting to note that, in the
case of higher number of occurrences of attributes (i.e., from 27 to 31, see
Table 6), the correlations achieved by
Dice
increase and are higher than


Search WWH ::

Custom Search