Global Positioning System Reference
In-Depth Information
Variability
1
w
att
w
part
GC
0.9
0.8
0.7
0.6
0.5
0.4
0.3
0.2
15
19
23
27
31
35
Attributes
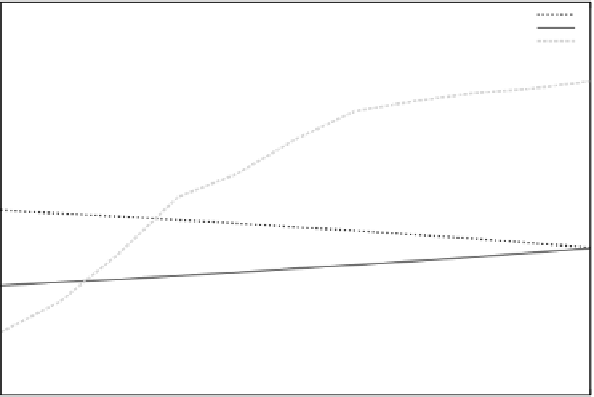
Fig. 7.
GC
v
and variability parameters by varying attributes' occurrences.
Color image of this figure appears in the color plate section at the end of the topic.
Regarding the variability parameters, shown in Fig.7, since
w
att
+
w
part
=1,
as
w
part
increases,
w
att
decreases. In the case of this last parameter, we note
that it decreases because
w
c
att
increases. We observe that the
correlation of
GSim
v
(
GC
v
for short) increases as well, and varies from 0.33 to 0.83. In Table
4, for attributes' occurrences equal to 15,
GC
c
=0.72 (Fig. 6), and
GC
v
=0.33
(Fig. 7). Whereas for attributes' occurrences equal to 35, both commonality
and variability parameters tend to coincide and are approximately equal
to 0.50. Consequently, the difference between
GC
c
and
GC
v
is very low and
both are approximately equal to 0.83. In fact, the difference between
GC
c
and
GC
v
is high for low occurrences of attributes and it is low for high
occurrences.
The impact of variation of attributes' occurrences on
GC
v
is high with
respect to
GC
c
. Since commonality of attributes increases, their variability
decreases, this leads to increase the variability of parts. In fact,
GC
v
increases
with the increase of
w
part
. In this case, commonality highlights attributes,
whereas variability highlights parts.
Concerning the second experiment, we fi x the number of attributes'
occurrences, say 25, and change the number of occurrences of parts. The
results are shown in Table 5, and presented graphically in Figs. 8, and 9.
In Fig. 8, we observe that as
w
c
part
increases,
w
c
att
decreases. We also observe
that
GC
c
increases with the increase of
w
c
part
and varies from 0.61 to 0.85.


Search WWH ::

Custom Search