Global Positioning System Reference
In-Depth Information
impacts signifi cantly on the commonality parameters
w
c
att
, and
w
c
part
as are
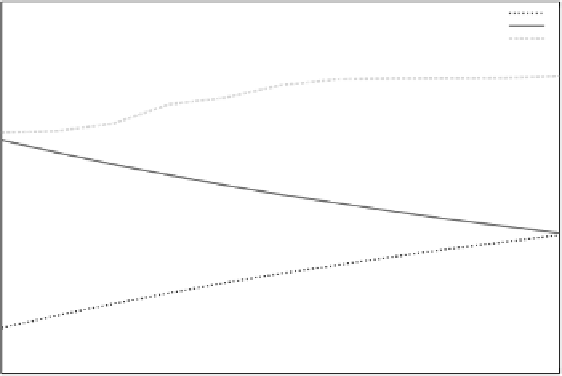
shown in Table 4, and presented graphically in Figs. 6 and 7. In Fig. 6, we
observe that, as
w
att
increases,
w
c
part
decreases (note that
w
c
att
+
w
c
part
=1). We
also observe that the correlation of
GSim
c
(
GC
c
for short) increases with the
increase of
w
c
att
and varies from 0.72 to 0.83.
Table 4.
Correlation of
GSim
and parameters by varying attributes' occurrences.
Occ. of Att.
w
part
w
att
w
part
w
c
att
GC
v
GC
c
15
0.423
0.577
0.702
0.298
0.3335
0.7191
17
0.430
0.570
0.675
0.325
0.3902
0.7248
19
0.436
0.564
0.650
0.350
0.5708
0.7751
21
0.443
0.557
0.627
0.373
0.6067
0.7772
23
0.450
0.550
0.605
0.395
0.6503
0.7903
25
0.458
0.542
0.585
0.415
0.7214
0.8198
27
0.465
0.535
0.567
0.433
0.7748
0.8310
29
0.473
0.527
0.549
0.451
0.7997
0.8340
31
0.481
0.519
0.532
0.468
0.8148
0.8342
33
0.490
0.510
0.517
0.483
0.8242
0.8343
35
0.499
0.501
0.502
0.498
0.8332
0.8345
Commonality
1
w
att
w
part
GC
0.9
0.8
0.7
0.6
0.5
0.4
0.3
0.2
15
19
23
27
31
35
Attributes
Fig. 6.
GC
c
correlation and commonality parameters by varying attributes' occurrences.
Color image of this figure appears in the color plate section at the end of the topic.


Search WWH ::

Custom Search