Environmental Engineering Reference
In-Depth Information
analysis techniques. Daniel (
1976
) developed a
modified form of Equation (
4.10
) that accounts
for interaquifer flow or evapotranspiration of
groundwater.
An alternative model proposed by Rorabaugh
(
1964
) assumes that recharge occurs at a con-
stant rate over time as opposed to instantan-
eously. This approach requires the use of type
curves and is not readily adaptable to automatic
computer application. Mau and Winter (
1997
)
found good agreement between estimates gen-
erated by the two Rorabaugh (
1964
) methods for
a small watershed in New Hampshire.
Few, if any, aquifers conform to all of the
assumptions inherent in the derivation of the
recession-curve displacement method. Even if
critical assumptions are met, Halford and Mayer
(
2000
) pointed out a number of shortcomings
and ambiguities; these include the subjective
nature with which the recession index and
N
are defined. Nonetheless, with the abundance
of streamflow data and the ease of automatic
computer application, the recession displace-
ment method remains a popular technique.
The recession index also can be determined
from groundwater hydrographs obtained from
observation wells (Rorabaugh,
1964
; Halford
and Mayer,
2000
), but stream hydrographs tend
to integrate over a larger part of the aquifer
than that represented by a single well. Recession
curve analysis is also used for estimating aqui-
fer transmissivity and specific yield (Rorabaugh,
1960
; Dewandel
et al
.,
2003
).
PART program identifies local minima on the
hydrograph with a slightly different algorithm
from that in HYSEP. PART produces estimates
of base flow; with some carefully worded
assumptions, the authors referred to results
of both PART and RORA as recharge. For the
recession-curve displacement method, critical
time was determined from Equation (
4.11
), and
the recession index was determined by com-
pilation of a master recession curve using the
RECESS computer program (Rutledge,
1998
)
for streamflow data in all months except June,
July, and August (to avoid possible effects of
evapotranspiration).
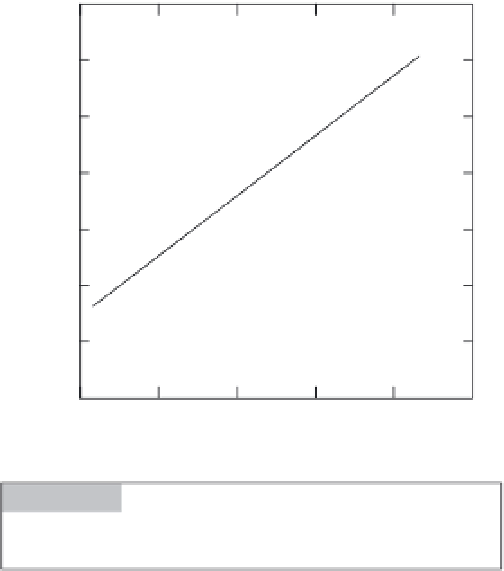
Average annual recharge determined by
both methods ranged approximately from
150 to 740 mm. Recharge estimates gener-
ated by RORA results were on average about
50 mm/yr greater than those of PART for indi-
vidual sites (
Fig ure 4.12
). Risser
et al
. (
2005a
)
also applied RORA on a monthly basis (
Figure
4.13
). They found a clear seasonal trend with
almost 80% of recharge occurring between
November and May. A drawback to the RORA
method is illustrated by the fact that at one
site the estimated recharge exceeded mean
annual streamflow.
889
762
635
Example: streamflow hydrograph
analyses of Pennsylvania streams
Risser
et al
. (
2005a
) analyzed streamflow
hydrographs from 197 streamflow sites across
the state of Pennsylvania for the period of
1885 through 2001 to generate estimates of
groundwater recharge. Each site had at least
10 years of records and a drainage area not
greater than 1400 km
2
. Only sites that were not
impacted by upstream regulation, withdraw-
als, or wastewater return flow were selected.
Hydrograph separation (PART; Rutledge,
1998
)
and recession-curve displacement techniques,
the RORA computer program (Rutledge,
1998
),
were applied with mean daily discharges. The
508
381
254
127
0
127
254
381
508
635
762
Recharge estimates from PA RT (mm)
Figure 4.12
Comparison of mean annual estimates
calculated by PART and RORA for 197 streamflow sites in
Pennsylvania (after Risser
et al
.,
2005a
).