Information Technology Reference
In-Depth Information
Residuals vs Fitted
Scale−Location
6
l
6
l
7
l
16
l
l
l
l
l
l
l
l
l
l
l
l
l
l
l
l
l
l
l
l
l
l
l
l
l
l
l
l
l
l
l
l
l
l
l
l
l
l
l
l
l
l
l
l
l
l
l
l
l
l
l
l
l
l
16
l
7
20
40
60
80
100
120
20
40
60
80
100
120
Fitted values
Fitted values
Normal Q−Q
Residuals vs Leverage
0.5
6
6
l
l
27
l
l
l
l
l
l
l
l
l
l
l
l
l
l
l
l
l
l
l
l
l
l
l
l
l
l
l
l
l
l
l
l
l
l
l
l
l
l
l
l
l
l
l
l
1
l
l
l
l
l
l
l
l
Cook's distance
l
16
l
l
7
l
−2
−1
0
1
2
0.00
0.04
0.08
0.12
Theoretical Quantiles
Leverage
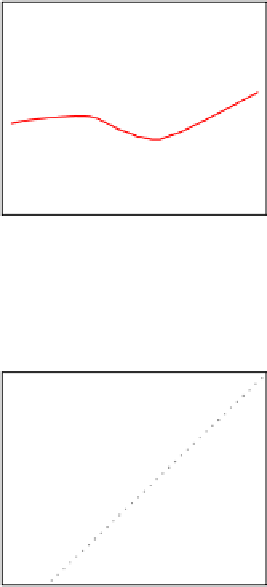
Figure 1-7. Diagnostic plots: pretty good fit
In contrast,
Figure 1-8
shows the diagnostics for a not-so-good regression. Observe that
the Residuals vs Fitted plot has a definite parabolic shape. This tells us that the model
is incomplete: a quadratic factor is missing that could explain more variation in
y
. Other
patterns in residuals are suggestive of additional problems; a cone shape, for example,
may indicate nonconstant variance in
y
. Interpreting those patterns is a bit of an art,
so I suggest reviewing a good topic on linear regression while evaluating the plot of
residuals.
There are other problems with the not-so-good diagnostics. The Normal Q-Q plot has
more points off the line than it does for the good regression. Both the Scale-Location
and Residuals vs Leverage plots show points scattered away from the center, which
suggests that some points have excessive leverage.