Information Technology Reference
In-Depth Information
Residuals vs Fitted
Scale−Location
28
l
28
l
30
l
1
l
30
l
1
l
l
l
l
l
l
l
l
l
l
l
l
l
l
l
l
l
l
l
l
l
l
l
l
l
l
l
l
l
l
l
l
l
l
l
l
l
l
l
l
l
l
l
l
l
l
l
l
l
l
l
l
l
l
0
100
200
300
400
500
0
100
200
300
400
500
Fitted values
Fitted values
Normal Q−Q
Residuals vs Leverage
28
28
l
l
0.5
30
l
30
l
1
l
1
l
l
l
l
l
l
l
l
l
l
l
l
l
l
l
l
l
l
l
l
l
l
l
l
l
l
l
l
l
l
l
l
l
l
l
l
l
l
l
l
l
l
l
l
l
l
l
l
l
Cook's distance
l
l
l
l
−2
−1
0
1
2
0.00
0.04
0.08
0.12
Theoretical Quantiles
Leverage
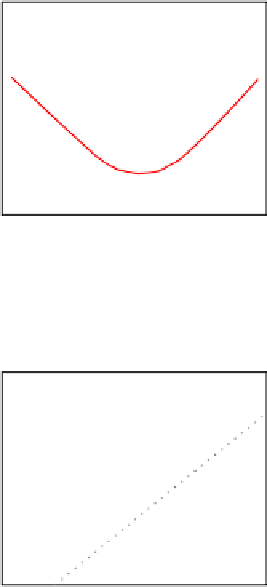
Figure 1-8. Diagnostic plots: not-so-good fit
Another pattern is that point number 28 sticks out in every plot. This warns us that
something is odd with that observation. The point could be an outlier, for example.
We can check that hunch with the
outlier.test
function of the
car
package:
>
outlier.test(m)
max|rstudent| = 3.183304, degrees of freedom = 27,
unadjusted p = 0.003648903, Bonferroni p = 0.1094671
Observation: 28
outlier.test
identifies the model's most outlying observation. In this case, it identified
observation number 28 and so confirmed that it could be an outlier.


