Geoscience Reference
In-Depth Information
150
Brisbane Dust
dry deposited dust
100
wet deposited dust
50
0
1
10
100
Diameter (
µ
m)
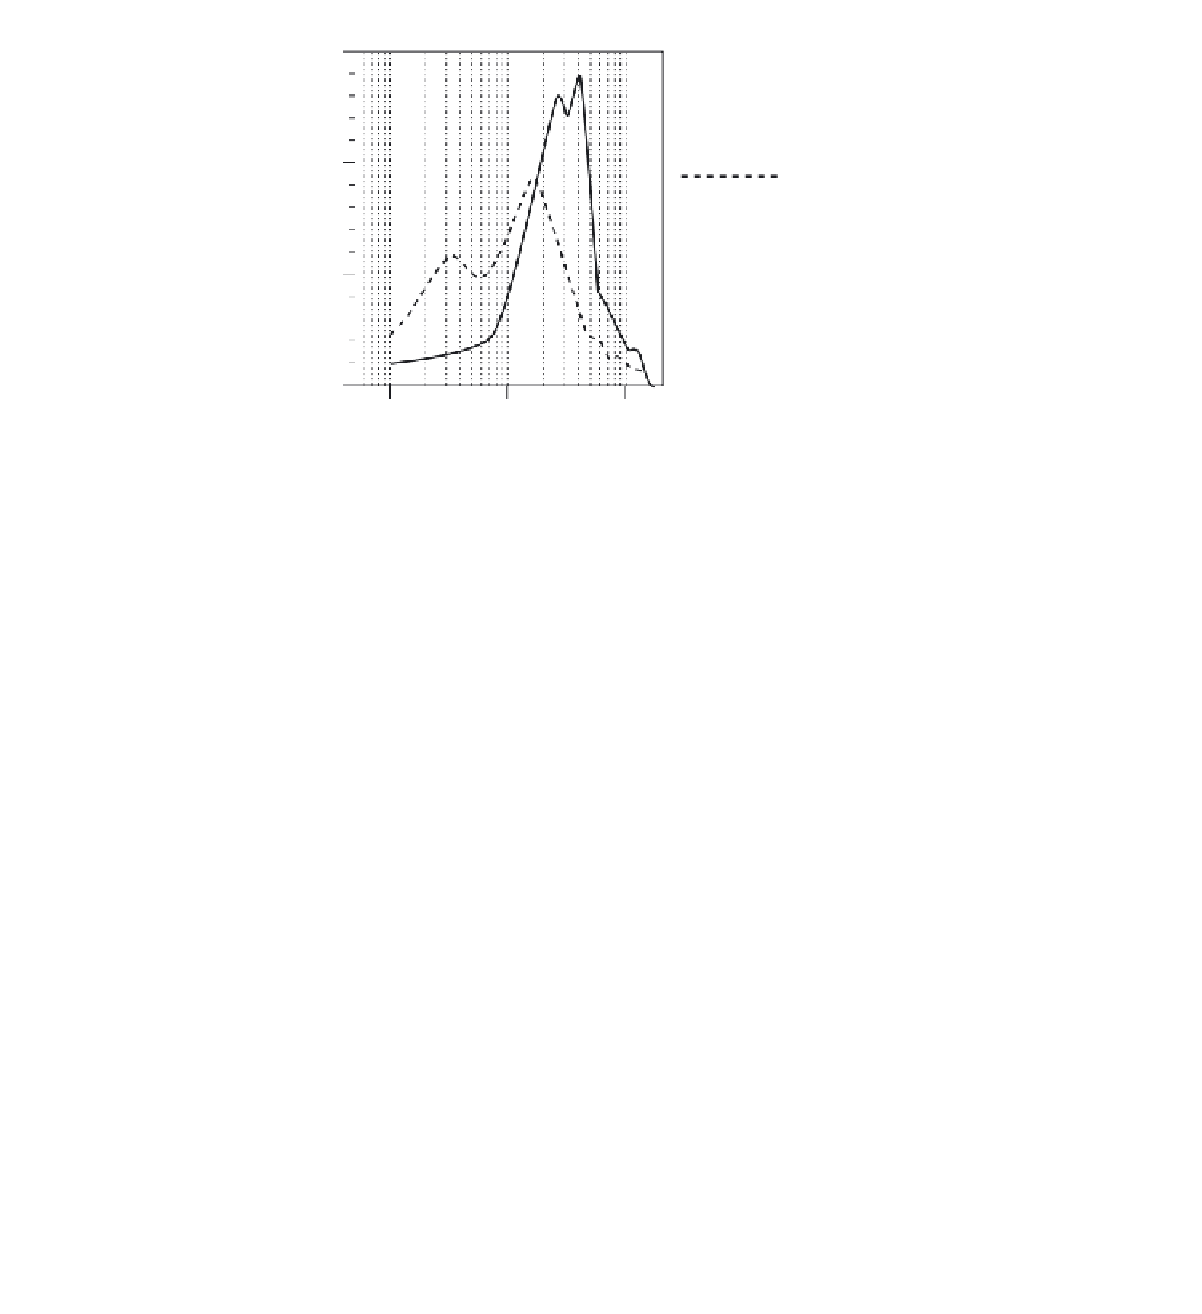
Figure 20.5
Particle size distributions of dust samples deposited by wet deposition (dashed line) and dry deposition (solid line)
in Brisbane (after Hesse and McTainsh, 1999).
activity it is difficult to draw conclusions about overall
dust deposition rates from relatively short-term studies
(1-2 years) such as those described above, and long-term
measurements of dust deposition rates are still very limited
in number. Two of the best known are the 15 year study
by Ta
et al.
(2004), who determined mean maximum de-
position rates of 498 t/km
2
yr in the Gobi Desert region
of China, and the 16 year study by Reheis (2006), who
measured average rates of 20 g/m
2
yr in southern Nevada
and California. These measured rates of deposition are
far lower than those occurring during the Quaternary, as
deduced from analysis of loess deposits (see Chapters 3
and 17 for discussion of loess). A study by Kohfeld and
Harrison (2003) suggests that glacial period dust depo-
sition rates in China were nearly 5 times higher than in
interglacial periods.
Once deposited, dust can become incorporated into
soils with a corresponding influence on their biogeo-
chemistry (Okin
et al.
, 2004; Cattle, McTainsh and Elias,
2009; Reheis
et al.
, 2009). Deposited dust can also have a
60
500
50
450
400
40
350
30
300
250
20
200
10
150
100
0
0
50 100
Dust deposition
150
200
250
300
350
Dust event