Biomedical Engineering Reference
In-Depth Information
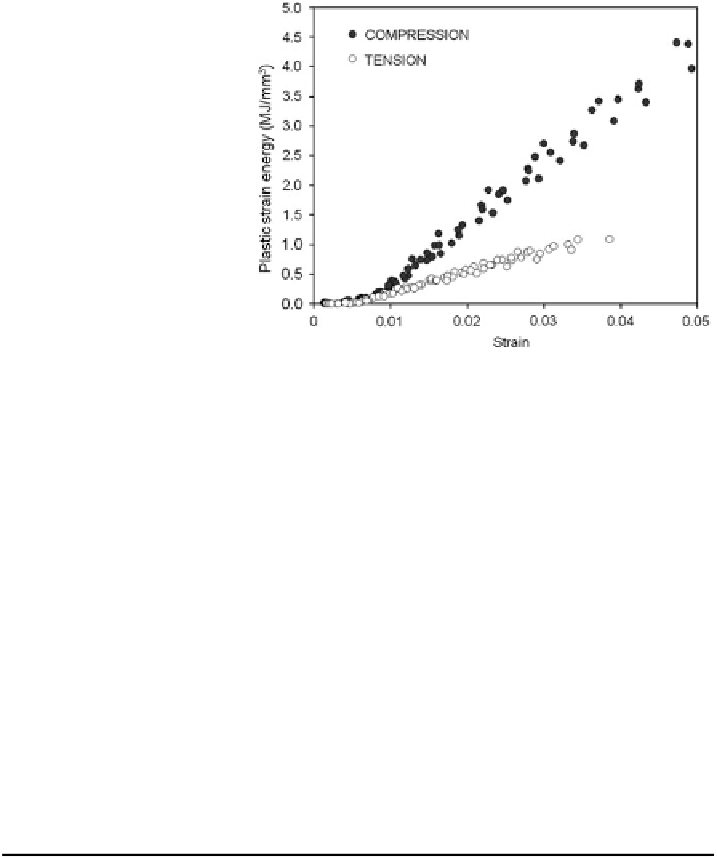
Fig. 11 Plastic strain energy
dissipation of human cortical
bone with respect to the
applied strain in both tension
and compression modes
Table 4
Ultimate strength and strain of human cortical bone measured in monotonic tests
Bone
Test
Orientation
Strength (MPa)
Ultimate strain (%)
References
Tension
Longitudinal
120-161
2.2-3.4
[
54
,
59
,
60
,
148
]
Tension
Transverse
53
0.7
[
54
]
Compression
Longitudinal
150.3-209
1.7
[
54
,
59
,
60
,
149
]
Femur
Compression
Transverse
131
[
54
]
Torsion
Longitudinal
74.1
5.2
[
51
]
3pt-Bending
183.4-194
[
63
,
64
,
157
]
4pt-Bending
174
[
150
]
Tibia
Tension
140.3-161
2.3-4.0
[
59
,
60
]
Compression
158.9-213
[
59
,
60
]
Fibula
Tension
146.1
[
59
]
Compression
122.6
[
59
]
Humerus
Tension
122.6
[
59
]
Compression
132.4
[
59
]
Radius
Tension
149.1
[
59
]
Compression
114.8
[
59
]
Ulna
Tension
148.1
[
59
]
Compression
117.7
[
59
]
3.3.3 Ultimate Strength and Strain
There is wide variability in failure strength and strain reported for human cortical
bones from different anatomic sites (Table
4
). In contrast to modulus, bone
strength depends on loading direction: bone is *50% stronger in compression
than tension [
60
,
62
]. Values of ultimate strength (specimens oriented longitudi-
nally) range from 120 to 161 MPa in tension, 120-213 MPa in compression,
174-194 MPa in bending, and 74 MPa in torsion. Bone strength is significantly
dependent on specimen orientation relative to loading direction. In general,

Search WWH ::

Custom Search