Biomedical Engineering Reference
In-Depth Information
Table 3 Yield stress/strain of femoral cortical bone
Loading mode
Yield strain (%)
Yield stress (MPa)
Type of test
References
Tension
0.6-0.7
Monotonic
[
79
]
Compression
0.6-1.1
Monotonic
[
80
,
81
]
Tension
0.4-0.5
Progressive
[
50
]
Compression
0.7-0.8
Progressive
[
32
,
82
]
Tension
114 ± 3.1
Monotonic
[
54
]
Torsion
0.13 ± 0.1
55.8 ± 3.8
Monotonic
[
156
]
3pt-Bending
154 ± 13
Monotonic
[
65
]
3pt-Bending
166 ± 12
Monotonic
[
117
]
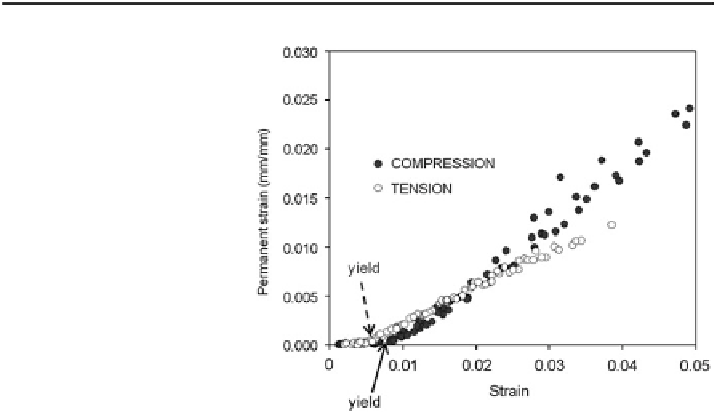
Fig. 10 Plastic deformation
(strain) of human cortical
bone (Tibia) with respect to
the applied strain in both
tension and compression
modes
in compression [
80
,
81
] (Table
3
). By plotting the permanent strain obtained using
the progressive diagnostic scheme versus the applied strain (Fig.
10
)[
50
], the
yield strain is estimated to be *0.4-0.5% in tension and *0.7-0.8% in
compression [
32
,
82
]. In addition, the plastic deformation is almost linearly
proportional to the applied strain.
3.3.2 Plastic Energy Dissipation
Plastic strain energy dissipation (U
p
) with respect to the applied strain is more than
two times greater in compression than in tension (Fig.
11
)[
82
-
84
]. The contrib-
uting factors to the much higher plastic energy dissipation in compression are: (1)
higher stress is needed in compression to produce a similar (post-yield) strain
compared to that required in tension, and (2) bone can sustain greater plastic
deformation in compression than tension at the same applied strain level. It seems
likely that the predominant damage formed by compression (cross-hatch type [
77
])
allows for more plastic deformation than the damage formed by tension (diffuse
type [
77
]).

Search WWH ::

Custom Search