Graphics Reference
In-Depth Information
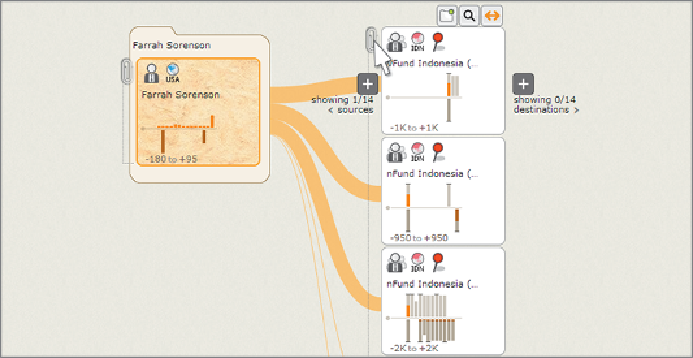
Figure 15-10:
Expanding a stack reveals members of the cluster, which, in
this case, are five loan accounts administered by the same partner. Width
of line indicates how much Farrah lends to each.
In this case, each of the accounts belongs to the same partner. Because
partners act as brokers, where all fund transfers are associated with one
particular loan, there is an account for each loan. In this case, all five loans
that Farrah gives to are apparently managed locally by the same partner.
Because Farrah is the highlighted account (outlined in orange), the subset
of transactions that involve her in the linked accounts to the right are also
highlighted in orange. Highlighting is a way of seeing the pattern of activity
across links, in the context of all of the activity for that account.
The pattern of activity for partners should look symmetrical. Partners
simply broker payments between lenders and borrowers, so asymmetry
would suggest something unusual. It's difficult to tell, however, if this is the
case, because bars are being clipped, indicated by the black caps.
Clicking the highlight flow button on the top partner card makes it the
focus, as shown in
Figure 15-11
.
In addition to highlighting flow to adjacent
accounts, highlighting an account scales all activity charts to it. Now that
they have been rescaled, the charts reveal that the pattern of transactions
is indeed symmetrical, albeit sometimes with a minor delay in processing
repayments. Flow lines and cards provide a rapid means of understanding