Graphics Reference
In-Depth Information
transaction activity between entities, as well as scanning for abnormal
patterns.
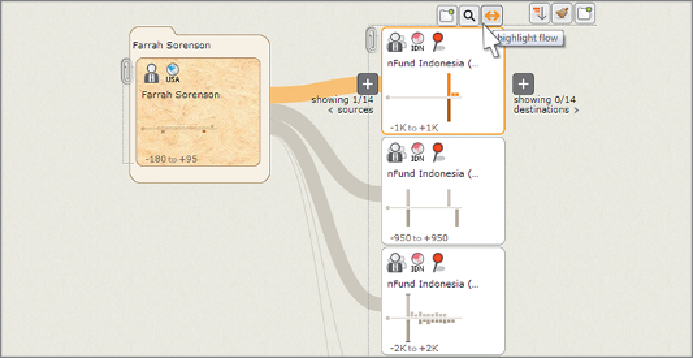
Figure 15-11:
Highlighting a card shows the subset of transactions
involving that account in other accounts and scales other charts to it.
Collapsing the partner stack using the paper clip and highlighting it scales
the charts to the sum of all transactions for that cluster. Clicking the branch
button on the right side of it retrieves all accounts that receive money
from it, as shown in
Figure 15-12
.
There are two stacks to the right. A
stack of five loans is represented by the plain person icon. Because lenders
receive repayments that partners pass along, all contributing lenders to the
five loans appear here as well, including Farrah. Now that members of the
cluster come from different countries, it is clear how the bars underneath
each icon work to indicate the proportion of members that share that
attribute. In this case, almost half of the lenders live in the United States.