Graphics Reference
In-Depth Information
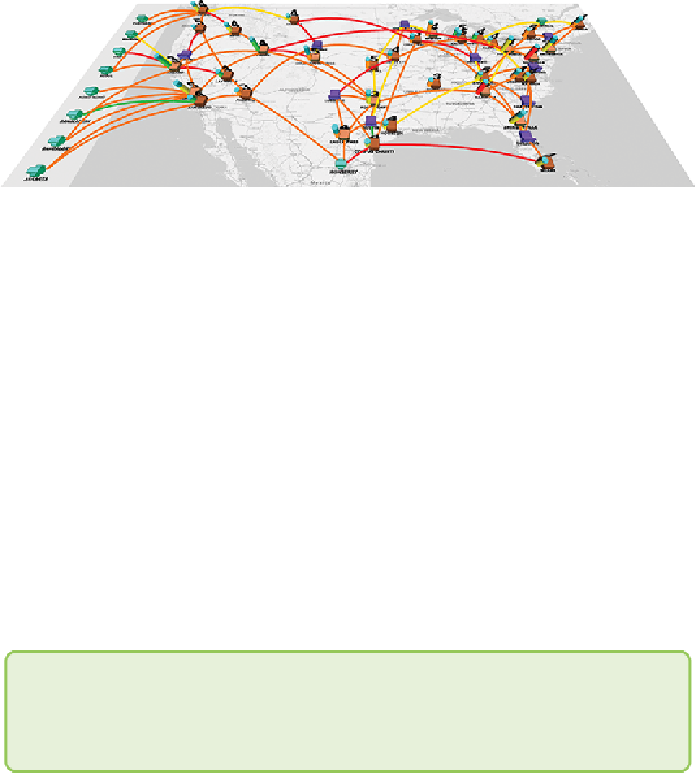
Figure 1-2:
One of the authors' first visualizations depicted a
manufacturing and distribution supply chain network.
Various types of analyses can be done with this kind of supply chain
visualization, ranging from inspecting individual routes to rationalizing the
overall number of factories and warehouses. One interesting finding was
that the costs between two particular factories doubled in March, June,
September, and December. On inspection, it was discovered that a
particular route was increasing shipping costs heavily at the end of each
quarter. Further investigation showed that this route switched from
land-based shipping to faster (but more expensive) air-freight shipping.
Some questioning revealed that this change was driven by high-level
objectives to reach quarterly targets. Because this pattern repeated
consistently every quarter, the analysts realized that better planning and
coordination between the two factories throughout the quarter could result
in a better shipping schedule, and a reduction of shipping costs in the last
monthofthequarter.Similarly,graphanalysisandvisualizationcanbeused
in the analysis and optimization of other supply chain networks.
Note
Chapter 9, “Relationships,” discusses basic graphs and relationships in
more detail.
Finding Anomalies
Spatial graphs
are often used to analyze the flow of goods around a
company or around the world. One excellent early example of a flow graph
is from Joseph Minard in the mid-1800s that, as shown in
Figure 1-3
,
examined emigration around the world. Looking at it, you can easily see
the flow of emigrants from the United Kingdom to the colonies, French