Graphics Reference
In-Depth Information
E5 and E6, note how
DFW-->LAX
is different from
LAX-->DFW
, whereas in
cells F5 and F6 they are the same.
In the next step, as shown in
Figure 7-2
, the links are aggregated into a
single link per origin-destination using a PivotTable in the spreadsheet,
with the rows set to the
DIRECTED LINK
column created previously, and
summaries based on counts and sums.
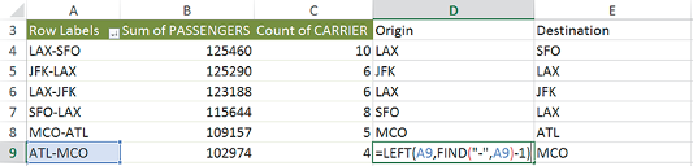
Figure 7-2:
These links have been aggregated with a PivotTable. The last
two columns are added to separate the origin and destination.
The first three columns are the PivotTable. The final two columns have been
added to split the route back into corresponding references to the origin and
destinationnodes.Asaresult,eachrowrepresentsasingleconsolidatedlink
ready to use in the graph software.
Figure 7-2
shows summarized directed
links—note how rows 5 and 6 are the links JKF-to-LAX and LAX-to-JFK.
If the data were summed based on undirected links, there would be only a
single entry for JFK-LAX.
See the
AirTrafficData-Jan2013.xlsx
Excel spreadsheet in the
FlightStats
folder of the Supplementary Materials on this topic's
companion website for an example.
Extracting Nodes
The previous example had both a data set of nodes and a data set of links
where the links were summarized. But in some data sets no separate list of
nodes is available, such as network logs. In network log data, each record
lists a connection (that is, a link). These links may need to be summarized.
In addition, a set of nodes must also be extracted.
Extracting nodes can be done by utilizing a similar approach with
PivotTableswithsummariesbasedonnodes.Becauseyouhavetwocolumns
of nodes (for example, source and target), you must create two PivotTables,