Graphics Reference
In-Depth Information
Excel
The spreadsheet has evolved beyond a simple data calculation tool into
a sophisticated and flexible repository for collecting, analyzing, and
summarizing data from multiple sources.
For preparation of graph data, Excel can be an effective tool in helping
you summarize links, extract nodes, or enhance the data with additional
attributes. For example, Excel is utilized to enhance data in the “Community
Topic Analysis,” in Chapter 11, “Communities.” Because the need to
summarize links and/or create nodes can be a common task with most
graph data sets, let's take a look at a quick illustration.
Summarizing Links
As discussed in Chapter 3, “Data—Collect, Clean, and Connect,” network
logs and air traffic data may have many links between a pair of nodes,
but some graph analysis will permit only one link between a pair of nodes
(or two directed links). You can use Excel's PivotTable functionality to
summarizeallthedatacorrespondingtoasourceanddestinationnode,thus
consolidating multiple links into a single link.
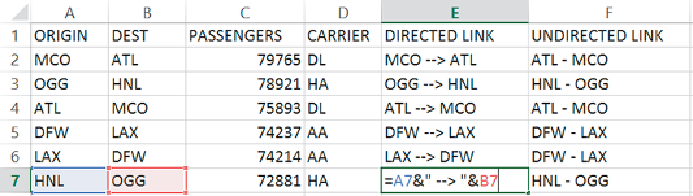
As a simple example, raw link data from air traffic data may appear as
shown in
Figure 7-1
. Note that an additional column has been added (E) to
concatenate the origin and destination into a single cell, which will be used
to create the summaries in the next step into directed links.
Figure 7-1:
This sample raw flight data in Excel has a
DIRECTED LINK
column and
UNDIRECTED LINK
column added.
For undirected links, column F instead places the origin-to-destination
order of the nodes into a consistent node1-node2 pair in alphabetic order
using the formula
=IF(A7<B7,A7&" - "&B7,B7&" - "&A7)
. In cells