Geography Reference
In-Depth Information
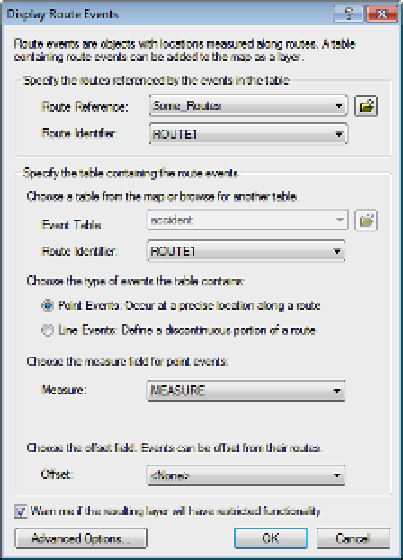
FIGURE 9-22
15.
Examine the map. Now you see the accidents from the table depicted on the map—put there by
a layer called Accident Events. Click the List By Source tab in the T/C.
For reasons whose logic or history escapes the author, points or segments within a route are termed
“events.”
16.
Open the Accident Events attribute table. Again use Select By Attributes to select ROUTE1 to
be 30000030. Show only selected records. Close the select by attributes window and resize.
Resize and rearrange the table so that you can see the map. Notice that the accidents on our
favorite route are highlighted. Sort the MEASURE attribute values, smallest to largest. Click the
gray box to the left of the record with MEASURE value 7.23. The record should turn yellow. The
point on the map should turn yellow. Display All Records. Choose Selection > Clear Selected
Features. Dismiss the table.
17.
Add and open the Pavement.dbf table. How many different pavement events are there?
________. Select those in Route 30000030. How many? ________. Notice that there is a
beginning mile point and an ending mile point field. Sort BEGIN_MP is ascending order. That
should also put END_MP in ascending order. The segments connect but do not overlap. Display
All Records. Clear all selections and close the table.
18.
Right-click Pavement in the T/C and make a layer from the Pavement.dbf table by using Display
Route Events. This time, of course, the event table should be “Pavement”
and it is a line
event.
The From-Measure should be BEGIN_MP and the To-Measure END_MP. Always the route
identifier is ROUTE1. Click OK. Click the Source tab in the T/C.


Search WWH ::

Custom Search