Geography Reference
In-Depth Information
the number has a gray background—fixed at that value by the Properties window. Prove this by
greatly enlarging the data frame. Its content will not change size. Return the data frame to a
reasonable size. Set the scale on the other two data frames to 1:40,000 as well.
9.
Grab a corner of a data frame and drag it close to an intersection of guidelines, and release the
mouse button. Notice that the boundaries of the frame snap to the guidelines. Fix up all three
data frames so that they fit the guides.
10.
Use Pan on the Tools toolbar to slide the geographics up toward the top of each data frame—
center it as well as you can. (Notice that while Pan is still an active tool, the zoom controls are
disabled—because you fixed the scale.)
11.
Use Select Elements to adjust the positions of the legends of each data frame. If you are a
perfectionist, you can fix up the sizes of the legends texts so that they are all the same. To do
this, select a legend, choose Properties to bring up a Legend Properties window, and change
virtually anything you want about the appearance of the legend. Cancel the Legend Properties
window if you brought it up.
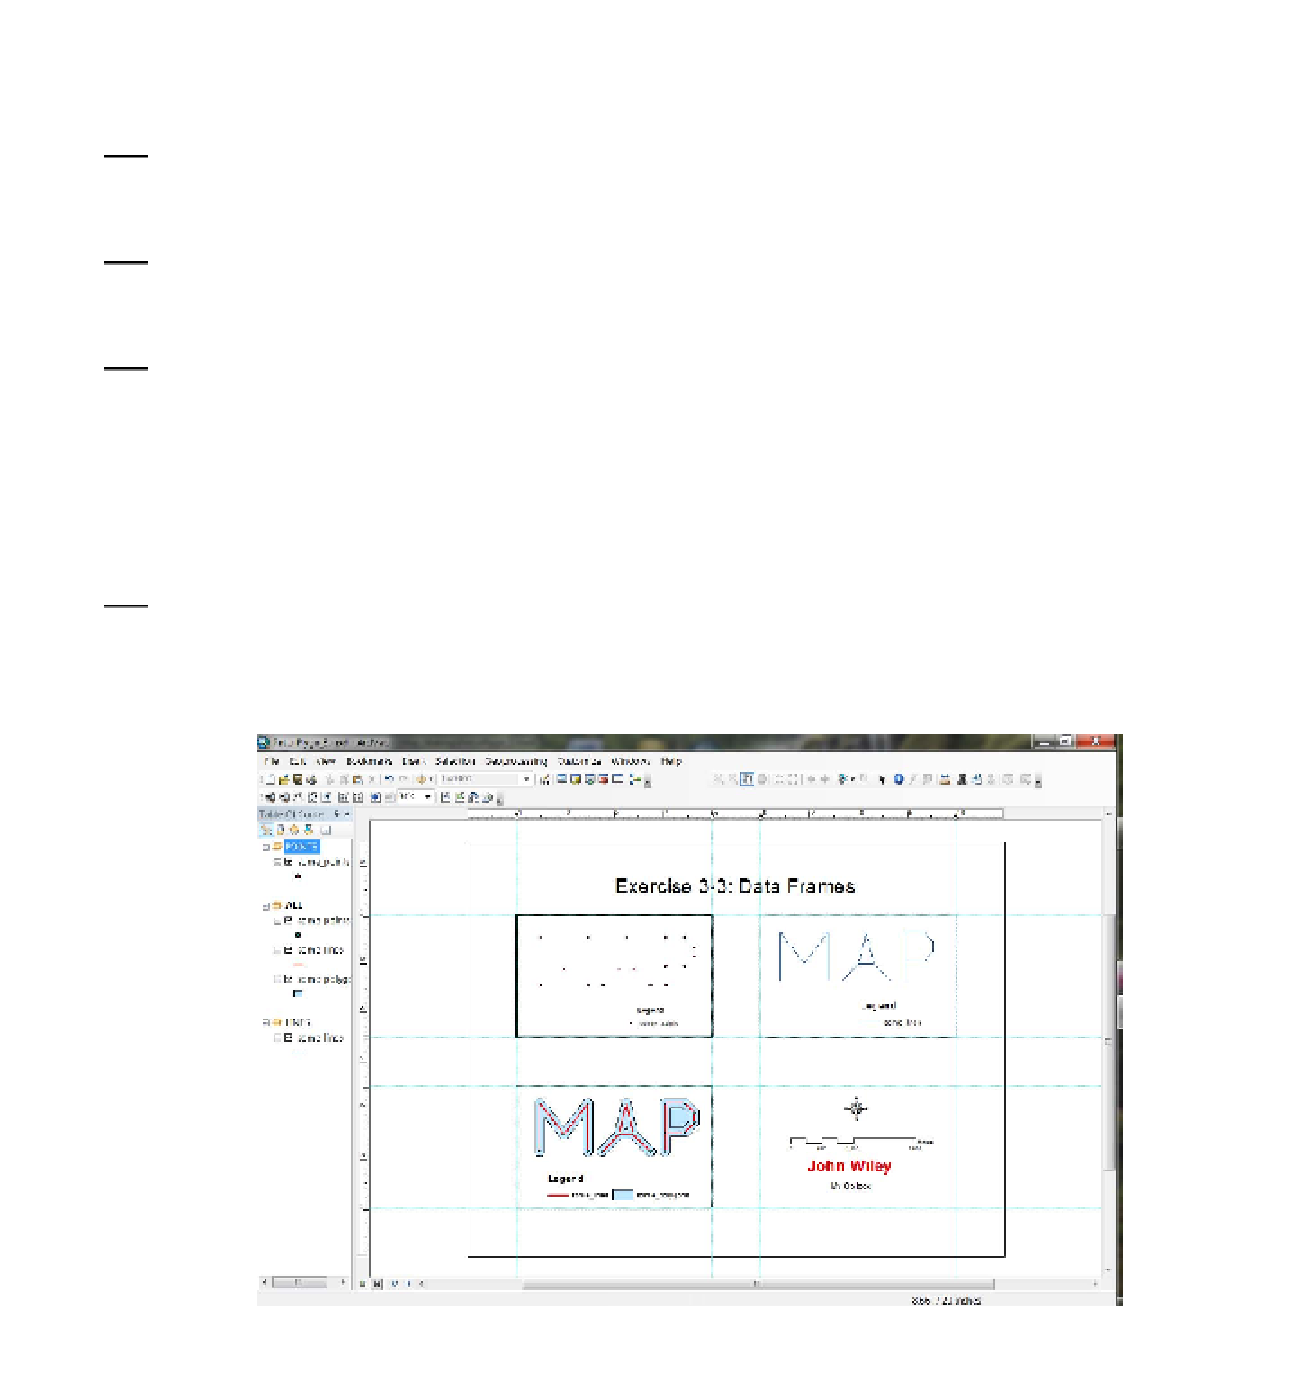
In the lower-right corner of the layout, you have a north arrow, scale bar, and a place for your name and
organization. In the next two steps, adjust the position of each of those, so the layout looks like Figure 3-9.
12.
Zoom up on the lower-right quadrant of the map. Click the Select Elements tool. Click the north
arrow to select it. Right-click there, then click Nudge > Nudge Left. The graphic moves a few
pixels to the left. Actually, if you simply tap the arrow keys on the keyboard, you can move the
graphic more quickly. Place the north arrow where you want it.
FIGURE 3.9


Search WWH ::

Custom Search