Geography Reference
In-Depth Information
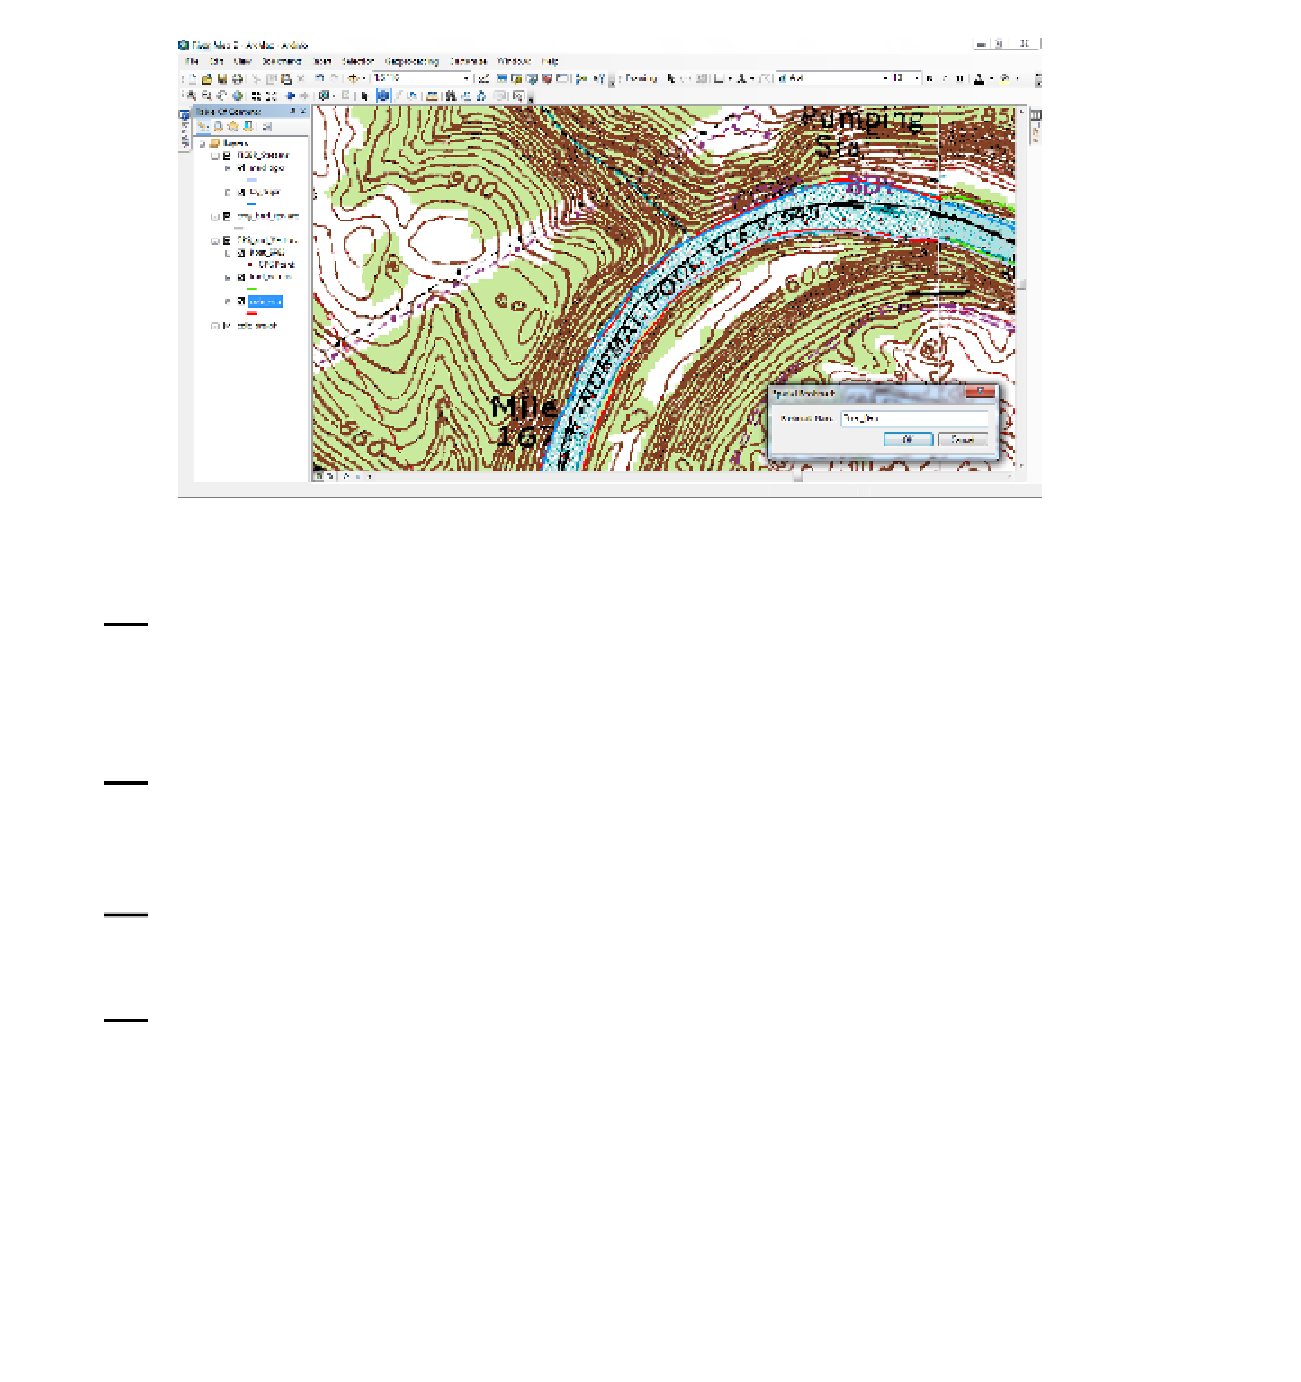
FIGURE 2-21
6.
Pan so that you can see the human-built artifacts (shown in purple) and text just
north of the bend of the river. What would you say was the function of this
facility? _____________________________. Zoom back to the Boat_SP83. Make a
bookmark of the GPS track view, so you can get to it more quickly. Call the bookmark whatever
you wish. Name it here: _______________________.
7.
Pick the colorful area near the island and zoom way, way in on the DRG, so that you can see
individual square pixels. In the T/C, click the plus (+) sign in front of the COLE_DRG.TIF. All 256
symbols
23
that could make up the image are now revealed. Actually, only the first dozen or so
are used.
8.
Open the attribute table for the DRG. What you see here is the number of pixels (picture
elements) of each value (color) on the map rather than information about the geography being
represented. See Figure 2-22.
9.
Click the Identify tool icon. Click on the map window to bring up the Identify Results window.
Look at the possibilities in the drop-down menu labeled “Identify from”. See Figure 2-23. You
can ask for results to be shown in the
Topmost layer
Visible layers
Selectable layers
23
Why 256? Because the index number of the colors is stored in a single byte, which as you know is 8 bits, which
allows two to the eighth power combinations, which is 2*2*2*2*2*2*2*2, which is 256.


Search WWH ::

Custom Search