Information Technology Reference
In-Depth Information
The Distribution of Voting,
Housing, Employment and
Industrial Compositions in
the 1983 General Election.
Low
High
Social Indicators
% Services Employees
% Electorate Voting
% Adult Employment
£ Mean Housing Price
Voting
Composition
Other Parties
Labour
Conservative
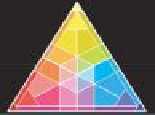
Facial features indicate
the social & economic
characteristics of the
constituencies, colour
shows the proportions
of the vote for each
party.
Figure 8.8 The death-like heads inside Glasgow city are solidly orange
(Labour/SNP) while the happy faces around the Capital voted solidly for the
government of the day. The Welsh may not have many jobs or expensive hous-
ing, but they still turn out to vote in large numbers. This technique is particularly
good for identifying exceptions, such as Tynemouth, Newham South and the Isle
of White - all odd places. Figure 2.2 shown earlier provides a key to the areas.


Search WWH ::

Custom Search