Information Technology Reference
In-Depth Information
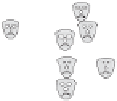
The Distribution of Voting,
Housing, Employment and
Industrial Compositions in
Constituencies in 1983.
Social Indicators
Low
High
% Services Employees
% Electorate Voting
% Adult Employment
£ Mean Housing Price
Facial features are in
proportion to the relative
values of the social
and economic
characteristics
of the areas they
represent.
Figure 8.9 It is preferable to omit voting colour when first seeing how the country
looks. The large fat and especially the happy faces in the far north of Scotland are
more visible here and London doesn't look quite as jolly within the centre of that
city when not distracted by political colour. The emaciation as you move towards
the North West is also more apparent. Colour always dominates.


Search WWH ::

Custom Search