Information Technology Reference
In-Depth Information
The Distribution of
Voting Composition
in the 1987, 1988
and 1990 British
Local Elections
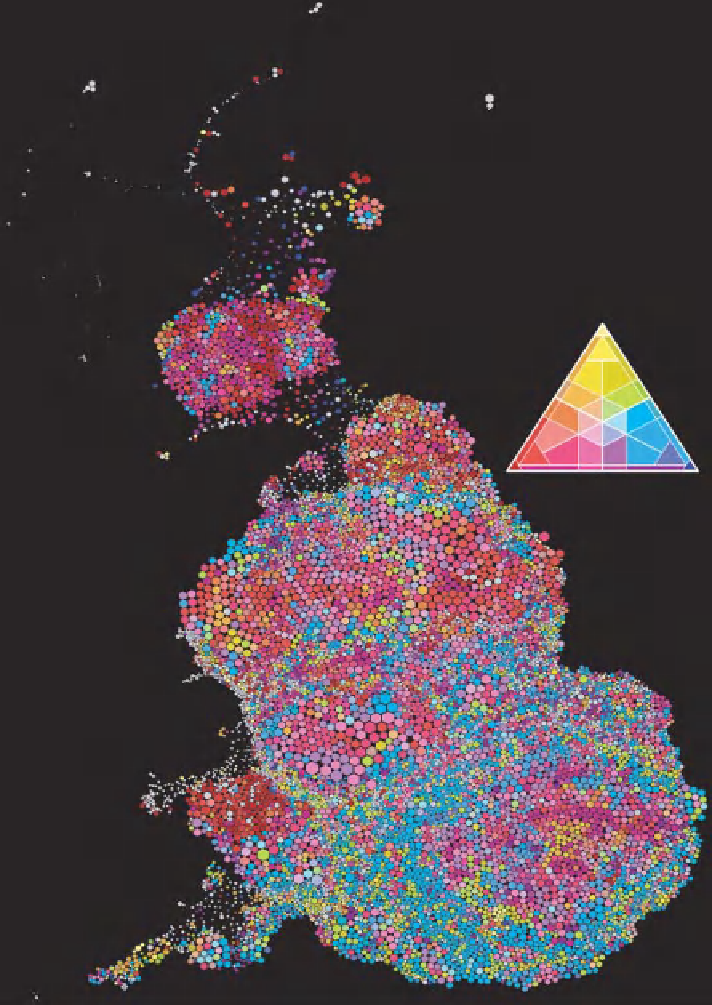
Proportion of the
Vote by Ward of:
Liberal / Alliance
Labour
Conservative
Figure 4.21 The triangle shows the colours for the safest seats at its corners,
easy wins next to them, two-way marginals in the middle of the sides and three-way
marginals at its centre.The cartogram clearly shows these results for all 10 444
wards, small and large. The pattern shown is similar to that of occupation. Local
party strongholds can be identified.
Search WWH ::

Custom Search