Environmental Engineering Reference
In-Depth Information
reach maximum by the second or the third tsunami which arrived at 15:40 JST,
which is consistent with the time indicated by the stopped clock.
The instruments used in the fi eld survey mainly include the RTK-GPS system, a
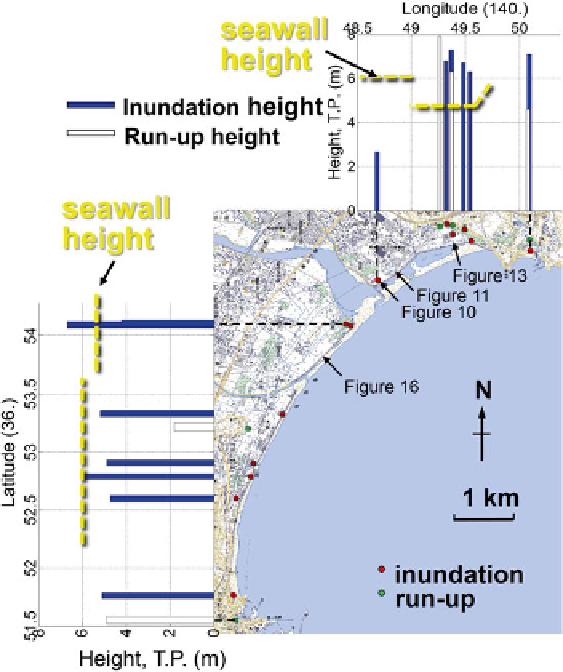
handy GPS, a laser ranger and a measuring staff. The coast is protected by seawalls
with top height 5.5-6 m in Sekita, Suga and Ooshima Districts and 4.2 m in Iwama
District. The heights of seawalls had been determined on the basis of storm waves
since the largest historical tsunami record was lower than the runup height of storm
waves. Five survey lines behind the seawall, i.e
.
, N1, N2, S1, S2 and S3 in Fig.
13.7
,
were also considered to estimate the tsunami profi les along the cross-shore direc-
tion. Figure
13.8
illustrates the height of watermarks compared with the top height
of seawalls. The blue bar indicates inundation height and the white bar denotes run-
up height. Tsunami heights near the shoreline are found to be 6-7 m T.P. except for
smaller tsunami observed in the southernmost region. Since the tsunami height on
the shore was larger than the seawall height by 1-3 m, inundation was developed
Fig. 13.8
Distribution of tsunami watermark heights in the Nakoso Coast compared with the hight
of seawalls; The inundation height is 6-7 m except in the south region (All the measurements are
registered as IBRK-0004 ~ IBRK-0016 in the TTSG database)
Search WWH ::

Custom Search