Environmental Engineering Reference
In-Depth Information
behind the seawall as shown in Fig.
13.7
. In the area close to the Samegawa River
and the Bindagawa River, fl ooding over the river banks was superimposed. The
smaller tsunami height in the south region is considered to be due to the sheltering
effect due to the Cape Unoko and breakwaters of two nearby fi shery harbours.
Iwama District located north of the Samegawa River was the most damaged
region. A number of the seawalls were broken, which appeared to increase the inun-
dation tsunami volume. To demonstrate the relationship between the seawall height
and tsunami damage, we conducted detailed measurements on the top height of
post-tsunami seawalls, which is presented in Fig.
13.9
Before tsunami, the seawall
in Iwama District had a total length of 2 km with two different designed heights, i.e
.
,
6.0 m on the south near the Samegawa River mouth with a length of 950 m, and
about 4.2 m for the remaining northern part. In the high seawall section, all seawalls
were intact after the tsunami attack; whereas, around 750 m long seawall was bro-
ken within the original low seawall section, i.e
.
, 71 % of the low seawall was
collapsed.
Figure
13.10
shows the seawall in the Ooshima District. Although the tsunami
overfl owed the 6 m seawall constructed on the ground level as low as 2 m T.P., the
damage was found to be insignifi cant. In this region, the seawall height had been
raised to the present 6 m after the overtopping of the storm waves in 1950s.
Figure
13.11
shows a typical damage behind the seawall. Although the parapet of
the seawall remained intact, the concrete apron on the landside was partially broken
with basement land scoured by the overfl owed tsunami.
At the location “A” in Fig.
13.9
, the seawall height suddenly decreases from 6.0
to 4.2 m. This is considered to be due to the presence of a wide barrier sand bar in
the Iwama District formed in front of the seawall, which decays the height of storm
waves. Figure
13.12a
shows a panorama image taken at this location. Careful
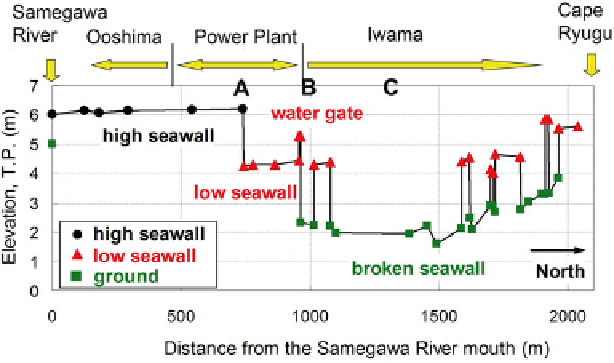
Fig. 13.9
Alongshore distribution of the post-tsunami seawall heights and ground elevations on
the north of the Nakoso Coast; The seawall height was discontinuous at Point 'A'. Most of the
lower seawall was broken. The symbols 'A', 'B' and 'C' refer to Fig.
13.7
Search WWH ::

Custom Search