Biomedical Engineering Reference
In-Depth Information
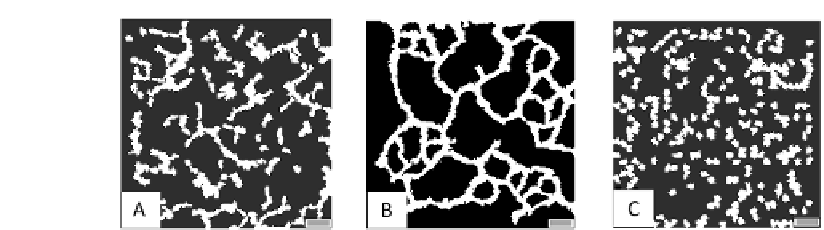
FIGURE 7.9: Increasing VEGF degradation rate (i.e., doubling
v
in Equa-
tion (6.5)): (A) downregulation of network organization at 24 h (12000
MCS), (B) formation of a reduced-in-scale network at 36 h (18000 MCS).
(C) disruption of patterning by inhibiting VEGF uptake by TECs (i.e., im-
posing B(x;t;v) = 0 in Equation (6.5)). All the other model parameters are
the same as for the basic simulation in Figure 7.3. The scale bar is 100 m
long.
100, we observe the formation of groups of disconnected structures, while,
by increasing n, a single connected network forms. In particular, for a wide
range of cell densities, n 2 (100 ; 300), the typical length of chords and size
of lacunae remain approximately fixed, while the chord thickness grows to
accomodate the increasing number of cells, and, consequently, the number of
lacunae slightly decreases. Finally, for n > n
c2
= 300, we find a continuous
carpet of cells intersparsed by holes. Interestingly, this phenomenon resembles
the percolative and Swiss cheese transitions observed in the development of
physiological vasculatures [154, 360]: therefore such a topological property is of
biological relevance also for tumor-derived vascular cells, and may be directly
linked to the eciency of the nascent capillary plexus.
7.5 Testing Anti-Angiogenic Therapies
Having demonstrated the model consistency with experimental observations,
we are now in the position to predict the effect of potential anti-angiogenic
therapies, as already done in the case of single cell motion. As a quantitative
measure characterizing the pattern at the end of the simulations (i.e., at 12000
MCS 24 h), we introduce the total rate of tubule length (in m): it is dened
as the sum of the lengths of all mature cords, i.e., the structures formed by a
minimum of three detectable cells and connected through a node with a similar
one. In the standard parameter setting it is labeled as LT
T
and, on average,
is 2.423 10
3
5 10 m ( 2.423 10
3
px, mean of 20 simulations
standard deviation), agreeing well with the measurements reported in the


Search WWH ::

Custom Search