Geology Reference
In-Depth Information
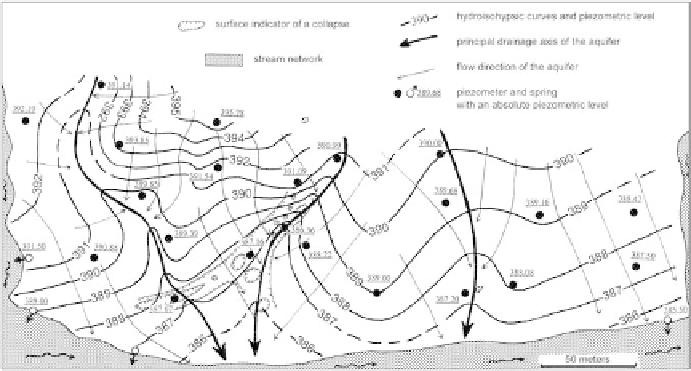
Figure 68
Partial piezometric map of a karst aquifer in a Triassic gypsum unit in Sospel
(Alpes-Maritimes), established October 2nd, 1980.
2) The piezometric map of a part of the Siagne alluvial aquifer, in
the Frayère and the Béal lower valleys, in the towns of Cannes
and Mandelieu (Alpes-Maritimes). This document was created on
October 17th and 18th, 2003, based on measurements in 41 wells,
water boreholes, and piezometers (Figure 69). The contour lines show
a general drainage towards the sea and a preferential collection in
several drainage axes. The hydraulic gradient has an average value
of 0.003 to 0.005 in the upper regions, and diminishes considerably
as it approaches the coastline (0.0005 to 0.001) due to the widening of
the plain. It increases, however, towards the western hillside (0.006 to
0.012), in relationship with the decreasing thickness and permeability
of the aquifer. The alimentation of the aquifer appears to be sustained
by infl ows from the Béal and Frayère valleys in the northern part of
the sector.
4.3 Piezometric variations
A map of piezometric contours provides a representation of the piezometric
surface at a given date. It is therefore often necessary, in order to judge
seasonal variations in this surface, to create several piezometric maps at
different times, and, particularly during extreme periods (fl ooding or high-
water, and dry season or low-water).
Additionally, a permanent monitoring can be undertaken by equipping
representative piezometers in the principal areas of the aquifer with a
recording device. The piezograms show water table fl uctuations over time,
Search WWH ::

Custom Search