Geology Reference
In-Depth Information
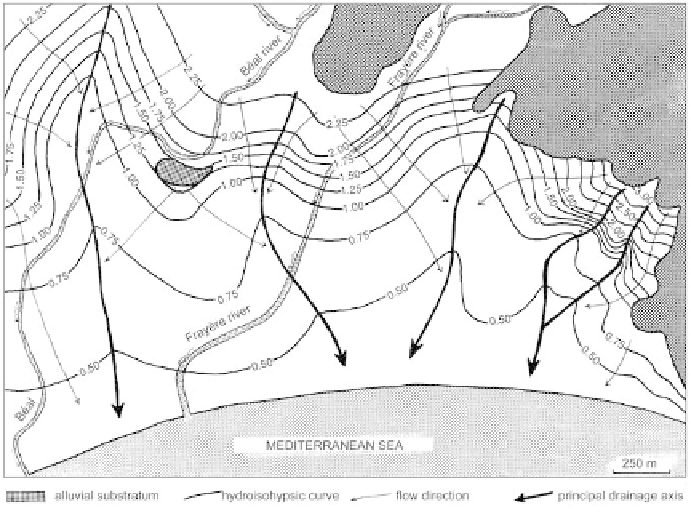
Figure 69
Partial piezometric map of the alluvial aquifer of the Siagne in the Frayère and Béal
lower valleys (Cannes and Mandelieu, Alpes-Maritimes), established in October 2003.
and can be correlated with rainfall, or with the discharge of a nearby river
when it is responsible for the main inputs to the aquifer (Figure 70).
The analysis of piezometric variations in map, view and in cross-
section, allows the determination of maximum and minimum values for
the piezometric level, as well as their average annual or inter-annual values.
It also provides a good estimate of the natural inputs to the aquifer and
the spatio-temporal evolution of its reserves, characterizing in particular
homogeneous sectors in terms of recharge and discharge.
Figure 70 presents the piezometric fl uctuations of three control wells
in the alluvial aquifer of the Var (Alpes-Maritimes) over the course of the
years 1989 and 1991, in which the inputs are largely governed by the river
fl owing out onto the plain. Relatively dampened fl uctuations are observed
in the downstream piezometers P15 and P35, whereas they are much more
marked in the upstream piezometer P41. Such amplitude is explained by
the local clogging of the minor Var bed, which then no longer feeds the
aquifer during periods of pronounced drought. The aquifer thus distinctly
dropped during the extreme drought of 1990, but then rose very rapidly
during fl oods due to losses from the river into its banks.
Search WWH ::

Custom Search