Geography Reference
In-Depth Information
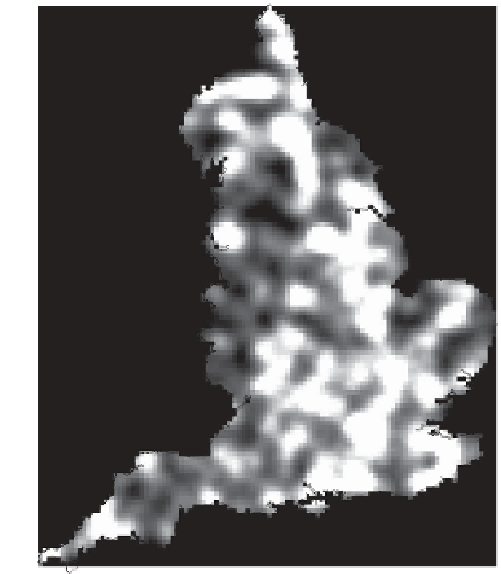
Intensity (sq. km)
High : 0.00868
N
Low : 0.00000
0
100
200 km
Figure 7.16
Event intensity for places in England shown on the Gough Map. This work is
based on data provided through EDINA UKBORDERS with the support of the ESRC and JISC
and uses boundary material which is copyright of the Crown (reproduced under the terms of
the Click-Use Licence).
period of the map's construction, but it is also partly due to biases on the part of the
map's creators, who selected some places of relatively minor importance at the time,
while some quite high status centres do not appear on the map.
h e
K
function could also be computed to assess clustering at dif erent spatial scales,
given that there are 461 places in the data set and that the area of England is approxi-
mately 130,410 square km (i.e. 130,410,000,000 square m), there is little suggestion of
clustering at any spatial scale
globally
. In terms of event intensity, there are clearly
spatial variations from place to place. As such, one possible way of extending the anal-
ysis is to use a
locally
computed
K
function (see Lloyd, 2006) to explore the possibility
of clustering at dif erent scales in dif erent regions.
h e synthetic data shown in Figures 7.1 and 7.2 are provided on the topic website as
is a guide to how the
L
function (see Figure 7.14) can be computed using these data
with freely available sot ware.


Search WWH ::

Custom Search