Geography Reference
In-Depth Information
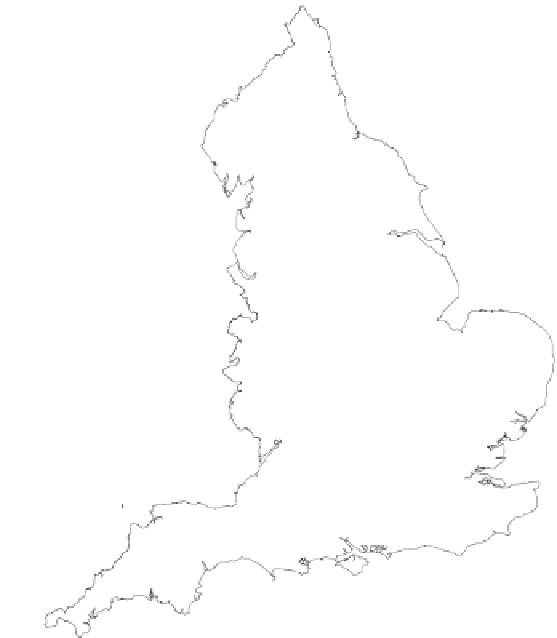
assess how representative the selection of places on the Gough Map is. For example, is
the intensity of events (i.e. places) dif erent for dif erent sources and does this tell us
anything about the purpose of these sources or where they were compiled? h e inten-
sity map was generated using ArcGIS™ Spatial Analyst. h e kernel radius was set to
25 km and the cell size was 5 km. ArcGIS uses a kernel based on that dei ned by
Silverman (1986, Equation 4.5). h is is the same form as the kernel dei ned in Equation
7.7. h e output gave intensities in square metres and these values were multiplied by
one million to give intensities in square kilometres (as 1000 m ¥ 1000 m = 1,000,000 m
2
).
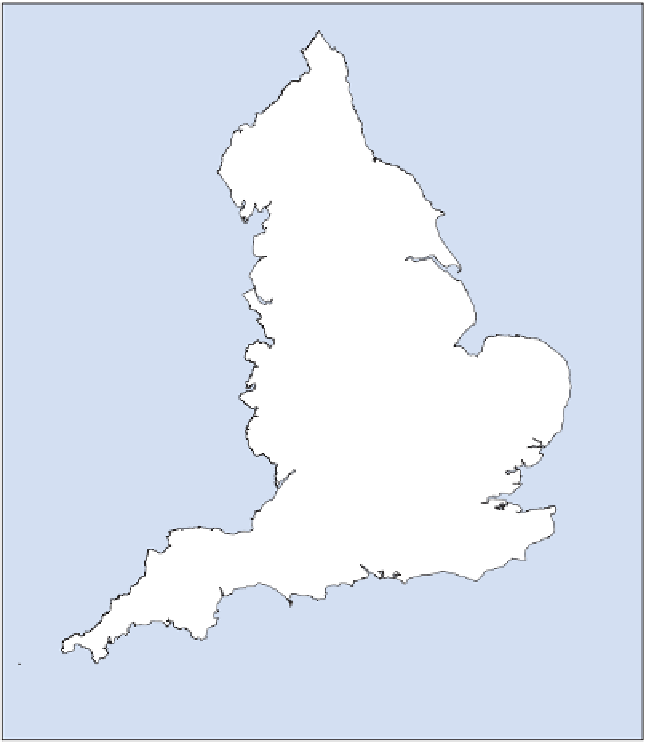
h e locations are shown in Figure 7.15 and the map of intensities is given in Figure 7.16.
h e greater intensity in some regions (e.g. the south-east and mid- to north-east of
England) is partly a function of varying numbers of places in England during the
Places
0
100
200 km
Figure 7.15
Places in England shown on the Gough Map. This work is based on data
provided through EDINA UKBORDERS with the support of the ESRC and JISC and uses boundary
material which is copyright of the Crown (reproduced under the terms of the Click-Use Licence).


Search WWH ::

Custom Search