Database Reference
In-Depth Information
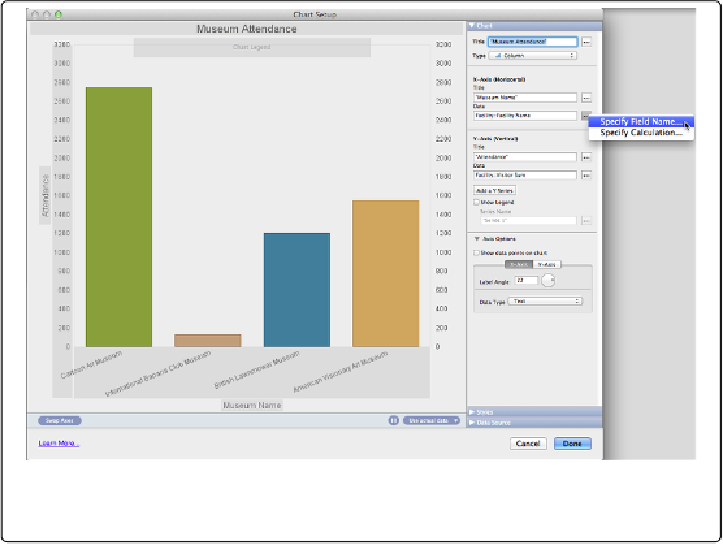
Figure 15-16. The axes of a chart can draw their data from a particular field as shown
here, or from a calculation you construct.
5.
Click the Facility Name field and then click OK
.
You see Facility::Facility Name in the X-Axis (Horizontal) field.
6.
Moving down to Y-Axis (Vertical), click the button to its right, select Specify
Field Name and then choose the field named Visitor Sum. Click OK
.
Facility::Visitor Sum appears in the Vertical (Y) Axis box.
7.
Leave all the other settings unchanged, click Done on the Chart Setup dialog box
and then switch to Browse mode
.
You should see a chart like the one in
Figure 15-17
. The bars are accurate, but the
chart isn't usable yet.
Gazing upon your first chart, some flaws are immediately apparent. The labels along the bot-
tom overlap so you can't read them, and the whole thing is squished into a small space. For-
tunately, FileMaker doesn't leave you without some options for whipping this chart into
shape: