Database Reference
In-Depth Information
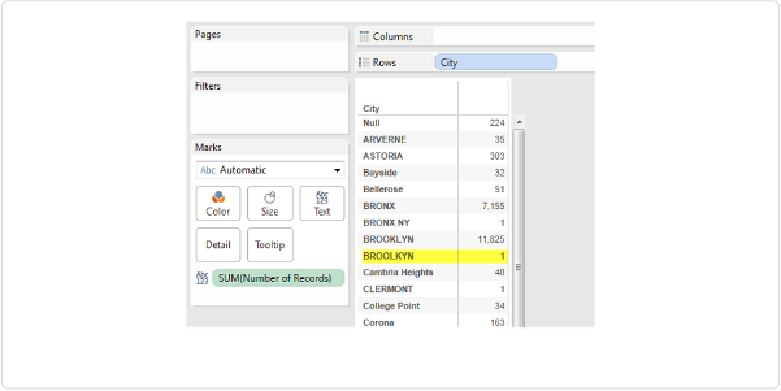
Figure 3-14. Using Number of Records to check for errors
Evidently, there was one record in which the city name was incorrectly recorded as
BROOLKYN
. These types of errors are ubiquitous, especially in human-recorded data sets.
Checking for them is an important part of the “exploring data” step outlined in
Figure 1-1
.
Returning to the boroughs analysis, you can see how the
Number of Records
field can now
be used just like the
RefuseTonsCollected
field in our previous example. In fact, Ctrl-se-
lecting
Borough
and
Number of Records
and then clicking the
Show Me
panel allows for
creation of all of the same chart types shown in
Figure 3-4
.
In this way, you can follow the same steps as in the previous example to create the dot chart
of rat sightings by borough shown in
Figure 3-15
.
Alternatively, you can create identical views to the ones shown by replacing
SUM(Number of
Records)
with
CNT(Unique Key)
. Each record has a unique identification key, and counting
how many unique keys are associated with each borough is identical to summing the number
of records.
To do this, right-click on
Unique Key
and drag it over the pill in the Columns shelf. When
you drop the field by releasing the right mouse button, a menu will appear that allows you to
specify how Tableau should deal with the
Unique Key
field. Choose
CNT(Unique Key)
and
notice that the only thing that changes is the green pill in the Columns shelf.